Report Overview
Featuring 44 tables and 17 figures – now available in Excel and Powerpoint! Learn More

Demand for plastic pipe is expected to rise 2.9% annually to $19.6 billion in 2026, a significant deceleration from the 2016-2021 period due to a notable slowdown in price growth from a high 2021 level. Demand will be driven by installation of pipe in the potable water, conduit, DWV, and storm and sanitary sewer markets as well as by the increasing use of larger diameter plastic pipes in some applications:
- Plastic pipe will continue to take share from copper pipe, primarily in potable water applications, due to its corrosion resistance, low cost, and ease of installation.
- Better resin formulations and enhanced processing technologies will continue to make plastic pipe more competitive in large diameter applications, such as those related to natural gas distribution and storm and sanitary sewers.
Major Spike in PVC & PEX Prices in 2021 Leads to Record Year in Value Terms
In 2021, average prices of PVC and PEX spiked 38% and 25%, respectively. The significant increase in prices was due to:
- major increases in raw material prices, as inflation reached the highest levels in the US in over 40 years
- significant supply chain issues and shortages
These price increases led to a massive spike in pipe demand in value terms. In linear feet terms, demand continued to grow despite rising prices, as the continued strength of home construction and renovation supported sales of potable water pipe.
HDPE & PEX to Experience Strong Growth Through 2026
Demand for HDPE and PEX pipe is expected to grow rapidly due to a number of performance advantages enabled by the flexibility of these materials. HDPE will find the greatest sales opportunities in the storm and sanitary sewer market, while PEX will continue to gain share in potable water distribution:
- HDPE’s flexibility makes it well suited for trenchless installation methods such as slip lining and horizontal directional drilling.
- PEX’s flexibility also facilitates installation in the water distribution market, as it can be bent around obstacles and cut easily.
Water & Sewer Infrastructure Upgrades to Benefit Plastic Pipe Suppliers
Water and sewer supply construction spending is forecast to see relatively healthy growth through 2026, as many communities face replacement of their aging water infrastructure. Federal spending is expected to constitute a significant driver of growth in these applications, boosted by the passage of federal infrastructure legislation.
Plastic pipe is used in a wide variety of markets and applications. As a result, demand is influenced by an array of economic factors:
- Building construction and infrastructure construction have the most significant effect on plastic pipe demand and are responsible for much of the market volatility seen on a year-to-year basis in the industry:
- Government spending on infrastructure influences demand for sewer and potable water applications, as well as for plastic pipe used as structural supports in bridges and other large structures.
- Building construction activity determines demand for DWV, water service and distribution, gas distribution, and conduit plastic pipe.
- Plastic pipe used in the oil and gas market is impacted by energy demand, drilling activity, and the price of oil and natural gas.
- Manufacturing activity determines demand for plastic pipe used in industrial processing, mechanical, and OEM applications.
- While sales opportunities for plastic pipe are limited in drilling applications, oil and gas drilling and construction activity also affect plastic pipe demand.
Demand for plastic pipe is also influenced by more general factors such as:
- raw material prices
- residential and commercial improvement and repair activity
- the amount of cropland planted
- supply chains
Because plastic pipe is a commodity product used in a number of mature industries, demand in value terms is susceptible to price fluctuations, as manufacturers will absorb changes in cost in order to keep their prices competitive.

Potable Water
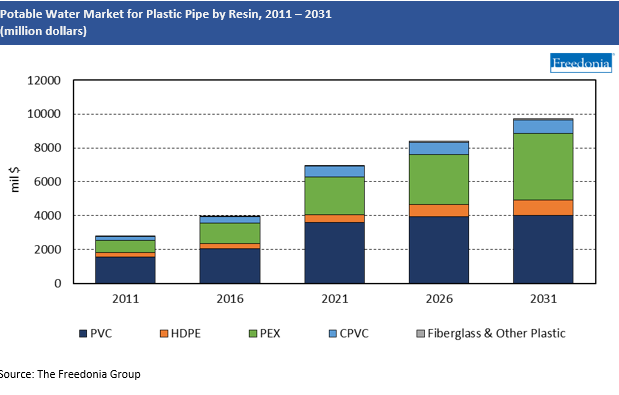
Demand for plastic potable water pipe is projected to expand 3.8% per year to $8.4 billion in 2026, making it the fastest growing potable water pipe material:
- Plastic pipe will continue to replace traditional materials, such as copper, due to its light weight, ease of installation, and corrosion resistance.
- Plastic’s lower cost than other materials is attractive for municipal water projects with tight budgets.
However, gains will be limited to an extent by uncertainty among local governments, engineers, and plumbing professionals about plastic’s longevity and health effects when used as water pipe.
Among resin types, PVC accounts for the leading share of plastic potable water pipe demand, supported by its widespread use in most water segments, including transmission, service, and rural pipes:
- In transmission applications, molecularly oriented polyvinyl chloride (PVCO) pipe has considerable performance advantages over other materials, including high flow rates, strength, and enhanced pressure tolerance.
- In underground applications such as service and rural pipe, PVC sees intensive use because of its pressure resistance, high joint integrity, and rigidity.
HDPE is expected to see healthy growth in linear feet terms, supported by the use of corrugated HDPE pipe in water transmission systems, where the material offers durability, flexibility, and corrosion resistance, unlike iron or steel pipe.
PEX is primarily used in distribution applications, such as radiant flooring and residential piping systems. Its ease of installation is the primary factor driving increased usage.