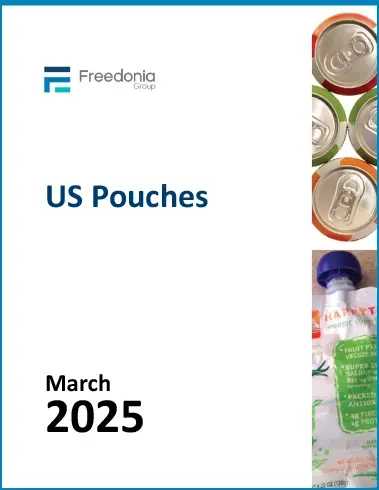
US Pouches
This study examines the US market for pouches. Product segments covered include flat (e.g., pillow, four-side seal, and three-side seal) and stand-up pouches (round-bottom/Doyen, K-seal, corner-bottom, flat-bottom and other) employed in food, beverage, and nonfood applications. Also discussed are pouch performance and/or physical characteristics.
Free Sample Report
Request a free sample of this report and our team will email it to you.
Report Overview
Pouch innovations in sustainability (monomaterials, refillables) and function/performance (spouts, resealability) to drive growth in a variety of new markets.
Key Themes Covered in this Report- Sustainability initiatives and the need to increase recycling rates will drive innovation in pouch design and support market expansion
- Innovation efforts by producers and end users to improve pouch performance and functionality, chasing new commercial and industrial applications
- New faster growing applications for pouches in consumer packaged goods outside of food and beverages
Featuring 81 Tables and 37 Figures!
Demand for packaging pouches in the US totaled more than $13 billion in 2024. Volume demand for pouches is expected to increase 1.5% per year to 142 billion units, valued at $15.4 billion, in 2029:
- Many products have transitioned to pouches in the past decade, and that shift is expected to continue (albeit at a somewhat slower pace).
- Pouches remain a contentious item in the quest for sustainable packaging. While they offer significant source reduction opportunities compared to rigid packaging, pouch producers must address issues with recycling to maintain growth momentum.
- Convenience and customization have become critical factors in packaging choices, and demand for pouches with specialty features – such as resealable closures, spouts, and attractive shapes – is increasing.
Pouches Reach Beyond the Snack Aisle to High-Value Consumer & Industrial Markets
Packaging producers are leveraging their successes in food to tap into fast-growing demand for lightweight, resealable, and eco-friendly solutions for categories like pet supplies, cosmetics and toiletries, DIY paints, automotive fluids, and refill packs. This is effectively reshaping the packaging mix across a variety of industries:
- In pet food, pouches continue to replace multi-wall sacks of dry kibble and metal cans of wet food, with even greater opportunities in the fast-growing fresh pet food segment.
- Consumer products utilize diverse arrays of packaging formats, with pouches increasingly preferred over traditional bottles, jugs, and cartons for their versatility. Diverse new applications driving growth range from hair and skin care products to drain cleaners and lawn fertilizers.
Sustainability Challenges Packaging Users; Fuels Pouch Opportunities & Innovation
Sustainability is no longer a value-added feature; instead, it has become a baseline expectation for packaging. Governments, businesses, and consumers are demanding recyclable and biodegradable solutions that reduce resource use. While pouches offer considerable source reduction opportunities compared to rigid packaging formats, the lack of effective solutions for sustainable end-of-life disposal may restrain demand.
Pouch manufacturers can enhance their market standing by improving recycling efficiency via monomaterial designs, incorporation of recycled content, and pursuit of refillable product lines.
Value-Added Technologies Fuel Further Growth of Stand-Up Pouches
Stand-up pouches continue to take share from flat pouches across a variety of markets – including entrenched applications such as breakfast cereal and condiments – due to their ability to provide product differentiation and incorporate convenience features like spouts, zipper seals, and retort filling capability. These allow for greater ease of use and provide additional boosts to the value and market potential of stand-up pouches. Additionally, newer stand-up types, such as squeezable inverted pouches, continue to make inroads in applications like dairy and condiments.
Historical Market Trends & Growth Factors
The market for packaging pouches is impacted by many factors that drive or restrain demand over time. At its most basic level, demand for pouches is tied to the outlook for the packaging industry overall, as almost all manufactured goods require some type of packaging. However, other factors that impact demand for pouches include:
-
general economic conditions and consumer spending trends, both of which impact the amount of goods that are purchased, produced, and packaged
-
the overall volume of US packaged goods manufacturing, as well as shifts in packager preferences and technological advancements in manufacturing and packaging
-
sustainability initiatives, as a growing consumer and industry focus on environmentally friendly packaging puts pressure on packaging manufacturers to develop recyclable, compostable, or biodegradable options
-
the rise of e-commerce, which may increase demand for lightweight and durable packaging (such as pouches), although those gains are somewhat offset by the need for product protection during transit
-
advances in manufacturing technology and packaging equipment and automation that could allow faster, more efficient production of pouches
-
raw material costs and availability, as pouch production relies heavily on plastic and paper materials
-
regulatory pressure, with governments worldwide introducing stricter regulations to address plastic waste and single-use packaging in general
-
bans on certain plastic formats, extended producer responsibility (EPR) programs, and recycling mandates may impact the supply and demand for pouches and other packaging that competes with pouches
-
compliance with such regulations often drives demand for alternative materials but also may drive sustainable packaging innovations
-
-
food safety and hygiene concerns, where ensuring food safety and extending shelf life is critical
-
product differentiation and branding, as consumer goods producers continuously search for ways to stand out from competitors and this can boost demand for unique packaging formats; however, oversaturation and commoditization of pouches could reduce their novelty on retail shelves
Pouches face competition from other types of flexible packaging (such as bags) and rigid packaging formats (such as bottles, cans, and cartons), particularly in applications like food, beverages, pet food, and household products. Programs or policies that encourage end users to adopt flexible packaging for its cost savings, efficiency, and sustainability can provide a boost to pouch usage.
Pouch Product Overview
Demand for packaging pouches in the US is forecast to increase 3.1% annually to $15.4 billion in 2029, equivalent to 142 billion units. Growth will stem from both advances in the number of units sold and higher average prices.
Pouches will continue to take market share from both rigid containers and other flexible formats, such as bags and film wrap, based on their functionality and convenience:
-
The advantages of pouches – such as their light weight, low package-to-product ratio, and ability to be shipped flat – have become increasingly important for reducing shipping costs and in light of retailer purchasing initiatives that favor packaging that meets certain sustainability guidelines.
-
Pouches allow brand owners to differentiate their products on crowded store shelves, as pouches offer excellent graphics capabilities.
-
Pouch production uses a fraction of the raw materials needed for rigid containers.
Stand-up pouches will continue to post the fastest gains as brand owners look to capitalize on opportunities that consumers identify as packaging priorities, such as:
-
resealability
-
clarity
-
ease of opening
-
convenience
Additionally, market value for pouches overall will continue to be supported by new product developments that incorporate a variety of specialty pouch features, such as:
-
spouts
-
resealable closures
-
specialty shapes
-
retort filling
Market Category Overview (Food vs. Nonfood)
The majority of pouch demand in the US is generated by the food and beverage market, and is generally more mature than the nonfood market; pouches have become common packaging in nearly all food categories.
The most important functions for pouches in the food and beverage market include:
-
maintaining freshness and reducing spoilage, thus extending shelf life
-
reducing or providing alternate portion sizes to meet consumer demand
-
enhancing product differentiation compared to rigid containers and plastic bags
The nonfood market encompasses medical supplies and pharmaceuticals, pet food, consumer products, and industrial products; it has been growing faster for pouches in recent years. Like the food and beverage market, pouches offer important advantages like product differentiation and size flexibility:
-
Pouches have replaced large woven polypropylene bags of dry pet food in many cases, while retort pouches continue to replace metal cans of wet food.
-
Pouches that are single-use and feature exact measurements have driven growth in a variety of nonfood markets, including pharmaceuticals, industrial cleaning chemicals, and dish and laundry detergents.
- Other consumer products, such as lawn and garden items and personal care products, have benefited from moves toward refill pouches in accordance with efforts to reduce plastic waste
US Pouches Report Details
| Current Total Market Size | $13 billion |
| Forecast Total Market Growth Rate | 3.1% CAGR from 2024-2029 |
| Historical Period | 2014, 2019, 2022-2024 |
| Forecast Period | 2025, 2026, 2029, 2034 |
| Units Covered | Revenue in million USD and million units |
| Regions | US |
| Countries Individually Covered | n/a |
| Products | Pillow Pouches, Side Seal Pouches, Stand-Up Pouches |
| Markets | Food & Beverage: Savory Snacks; Candy & Confections; Baked Goods; Processed Fruits & Vegetables; Fresh Produce; Dairy; Meat, Poultry, & Seafood; Sauces & Condiments; Prepared Foods; Other Foods; Juices & Fruit Drinks; Other Drinks |
| Nonfood: Pharmaceuticals, Medical Supplies & Instruments, Lawn & Garden Products, Soap & Cleaning Products, Wipes, Personal Care, Other Consumer Products, Pet Food & Treats, Industrial & Other Nonfood Markets | |
| Pouch Features | Resealable Pouches, Vacuum Pouches, Spouted Pouches, Retort Pouches, Shaped Pouches, Aseptic Pouches, Stick Pouches |
| Point Where Data is Measured | Manufacturer’s Level, Ex Factory |
| Additional Elements | Market Share, Short Term Pouch Industry Trends, Mergers & Acquisitions, Merchant v. Captive Production, Food & Beverage Industry Outlook, Technology Trends, Sustainability Initiatives, Consumer Preferences, Production Methods, Pricing & Inflation |
Key Participants Driving Trends in US Pouches
| Amcor | Mondi Group |
| Berry Global | PPC Flexible Packaging |
| C-P Flexible | Printpack |
| CDF Corporation | ProAmpac |
| Constantia Flexibles | SEE |
| Five Star | Sonoco Products |
| Hood Companies | Transcontinental |
Relevant Industry Codes for the Pouches Packaging
| NAICS 2017 North American Industry Classification System |
SIC Standard Industrial Classification |
||
|---|---|---|---|
| 322220 | Paper Bag and Coated and Treated Paper Manufacturing | 2671 | Packaging Paper and Plastics Film, Coated and Laminated |
| 326111 | Plastics Bag and Pouch Manufacturing | 2672 | Coated and Laminated Paper, NEC |
| 326112 | Plastics Packaging Film and Sheet (including Laminated) Manufacturing | 2673 | Plastics, Foil, and Coated Paper Bags |
US Pouches Report Scope
This study examines the US market for pouches. Product segments covered include flat (e.g., pillow, four-side seal, and three-side seal) and stand-up pouches (round-bottom/Doyen, K-seal, corner-bottom, flat-bottom and other) employed in food, beverage, and nonfood applications. Also discussed are pouch performance and/or physical characteristics such as:
-
resealable pouches
-
vacuum pouches
-
retort pouches
-
shaped pouches
-
spouted pouches
-
aseptic pouches
-
stick pouches
Food and beverage market segments for pouches include:
-
savory snacks (e.g., potato chips, corn/tortilla chips, pretzels, prepared popcorn, snack nuts, jerky)
-
candy and confections (e.g., chocolate and non-chocolate candy, chewing gum, snack bars, cough drops)
-
baked goods (e.g., cookies, crackers, rolls, bagels, biscuits, tortillas, cakes, pies, doughnuts, pastries)
-
processed fruits and vegetables (including dry beans and legumes)
-
fresh produce (e.g., vegetables, fruits, and salad)
-
dairy (e.g., cheese, ice cream, yogurt, butter, margarine, coffee creamer, sour cream)
-
meat, poultry, and seafood (excludes meat-alternative foods, such as plant-based hamburger patties)
-
meat (e.g., beef, veal, pork, lamb)
-
poultry (e.g., chicken, turkey, goose, duck)
-
seafood (all fish and shellfish)
-
-
sauces and condiments, along with dressings, dips, jams, jellies, preserves
-
prepared foods:
-
dinners
-
pasta and rice dishes
-
pizza
-
potato dishes
-
soups and stews
-
other prepared foods (entrées, prepared meats like fried chicken, prepared salads, sandwiches, appetizers, dips, sushi, puddings, and parfaits)
-
excluded from this category are basic cooking ingredients not combined with other foods and foods that require more preparation than heating or that require other ingredients to be added
-
-
other foods
-
baby food, including formula
-
breakfast cereals
-
dried coffee and tea (excluding ready-to-drink products)
-
eggs
-
fats and oils: cooking oils, salad oils, lard, and shortening
-
frozen prepared breakfast foods such as sausage biscuits or waffles
-
grain products not mixed with other ingredients: flour, cornmeal, rice, pasta
-
meal replacements and protein powders
-
meat alternatives
-
pancake and waffle mixes
-
soft drink syrups and concentrates
-
spices and seasonings
-
sweeteners and syrups
-
-
beverages (e.g., juices and fruit drinks, water)
Nonfood market segments include:
-
medical and pharmaceutical
-
consumer products (e.g., lawn and garden, soaps and cleaning products, wipes, cosmetics and toiletries)
-
pet food and treats
-
industrial and other products, including agricultural and other chemicals, and small industrial and electronic components and parts
Excluded from the scope of the study are bags and sacks, reusable pouches, non-packaging pouch applications (e.g., pouches for in-house sterilization of medical and dental instruments), and air cushioning pouch packaging systems.
Historical data (2014, 2019, and 2024) and forecasts for 2029 and 2034 are provided for pouch demand (including merchant and captive production) in current dollars (including inflation) by product type and market and in units.
- Executive Summary
- Figure 1-1. US Pouch Market
- Short Term Analysis
- Economic Forecast
- Table | Macroeconomic Indicators, 2023, 2024, 2025, &2026 (billion 2017 dollars & billion dollars)
- Short-Term Pouch Industry Trends
- Table | Annual US Pouch Demand by Product Type, 2022 - 2026 (million units)
- Table | Annual US Pouch Demand by Market, 2022 - 2026 (million units)
- Figure 2-1. US Pouch Demand, 2022 - 2026 (million units)
- Economic Forecast
- Overview
- Study Scope
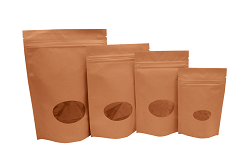
- Figure 3-1. Pouches: Product Examples
- Historical Market Trends & Growth Factors
- Table | Pouch Demand, 2014 - 2024 (million units & million dollars)
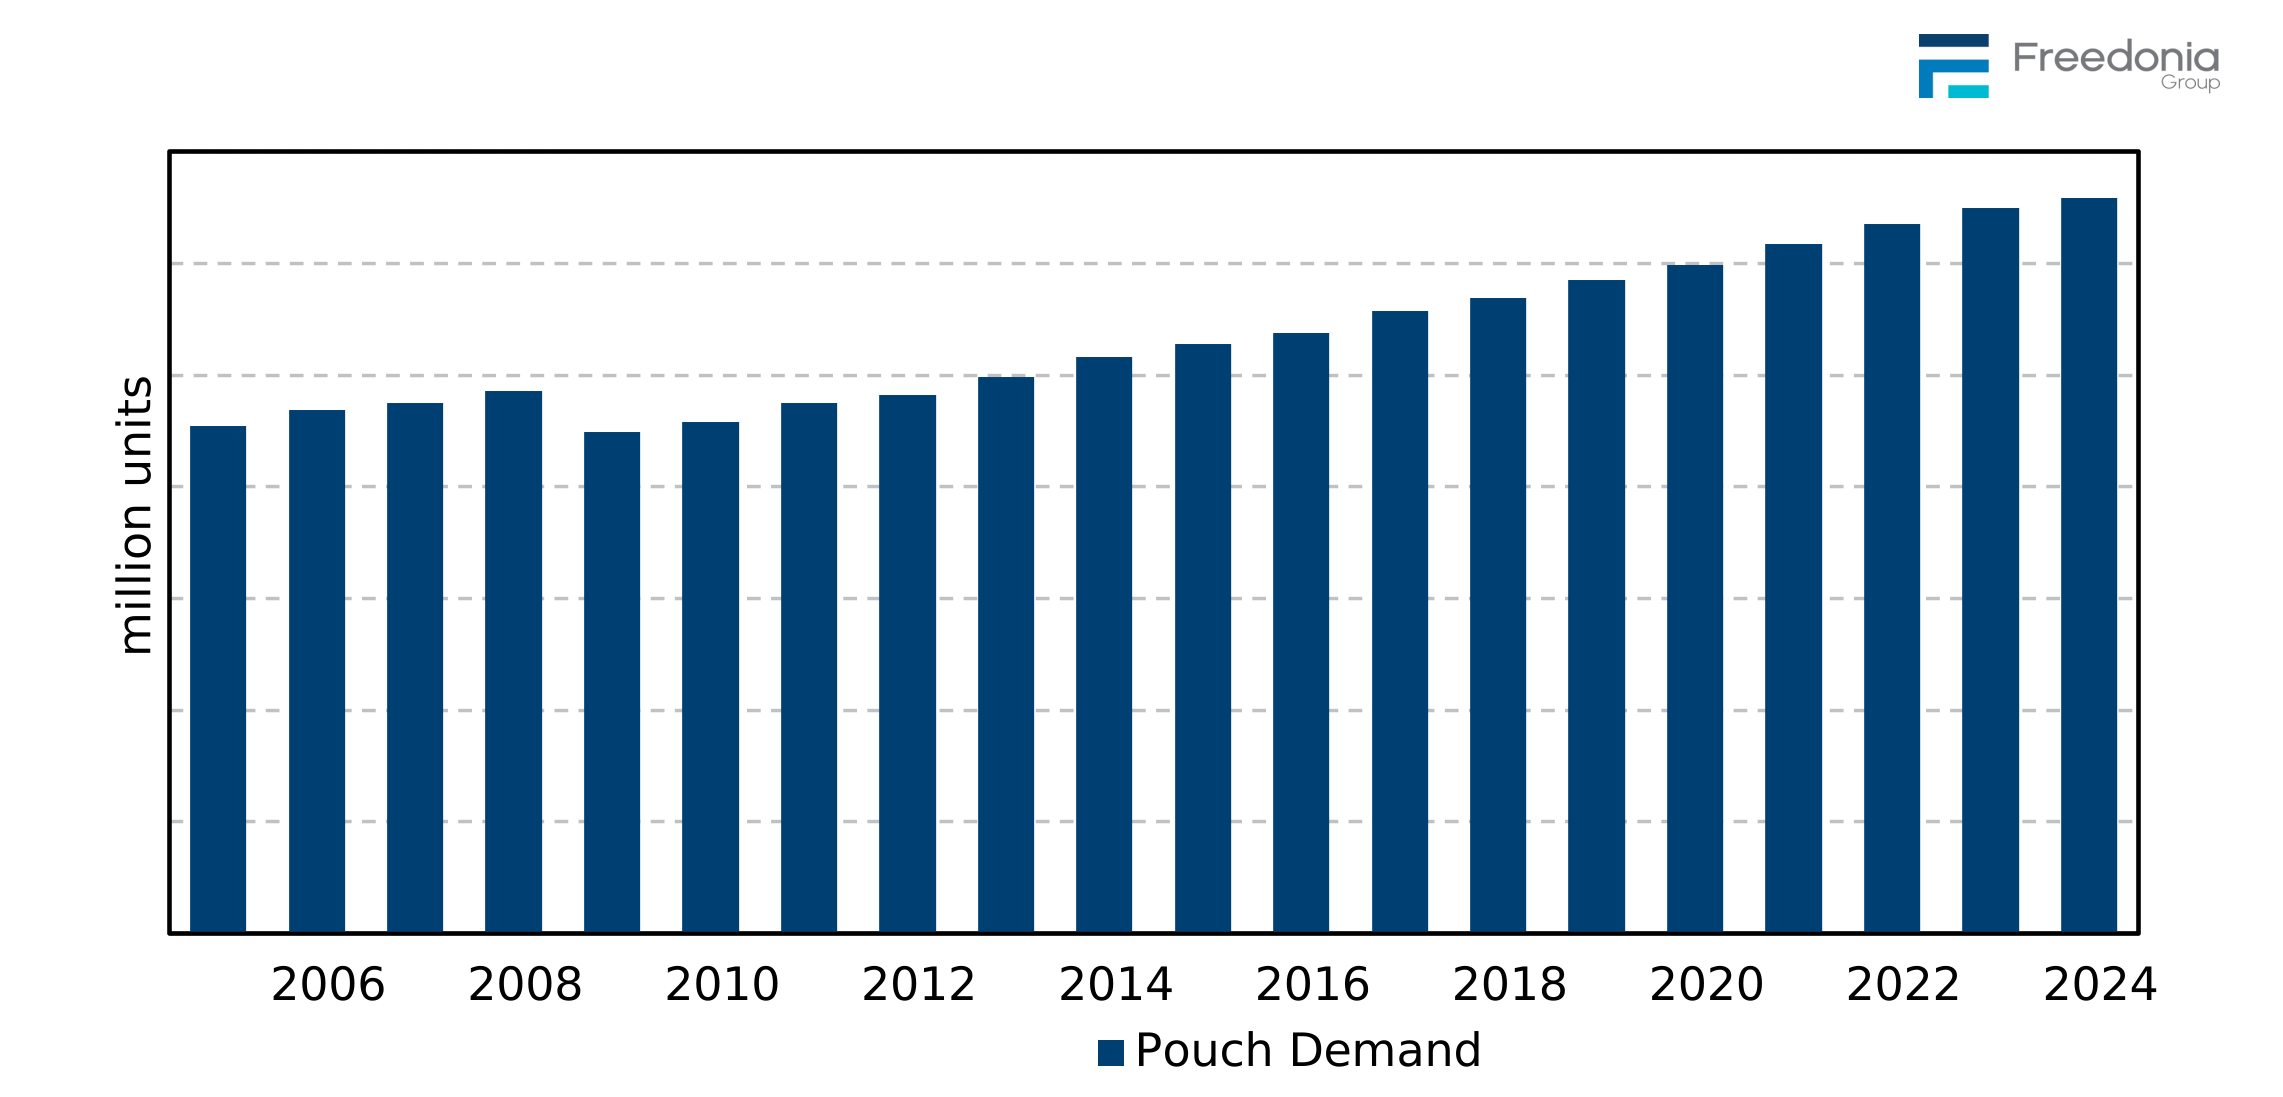
- Figure 3-2. Packaging Pouch Demand, 2005 - 2024 (million units)
- Pouch Product Overview
- Table | Pouch Demand by Product Type, 2014, 2019, 2024, 2029, &2034 (million dollars & million units)
- Table | Annual Pouch Demand by Product Type, 2021 - 2028 (million dollars & million units)
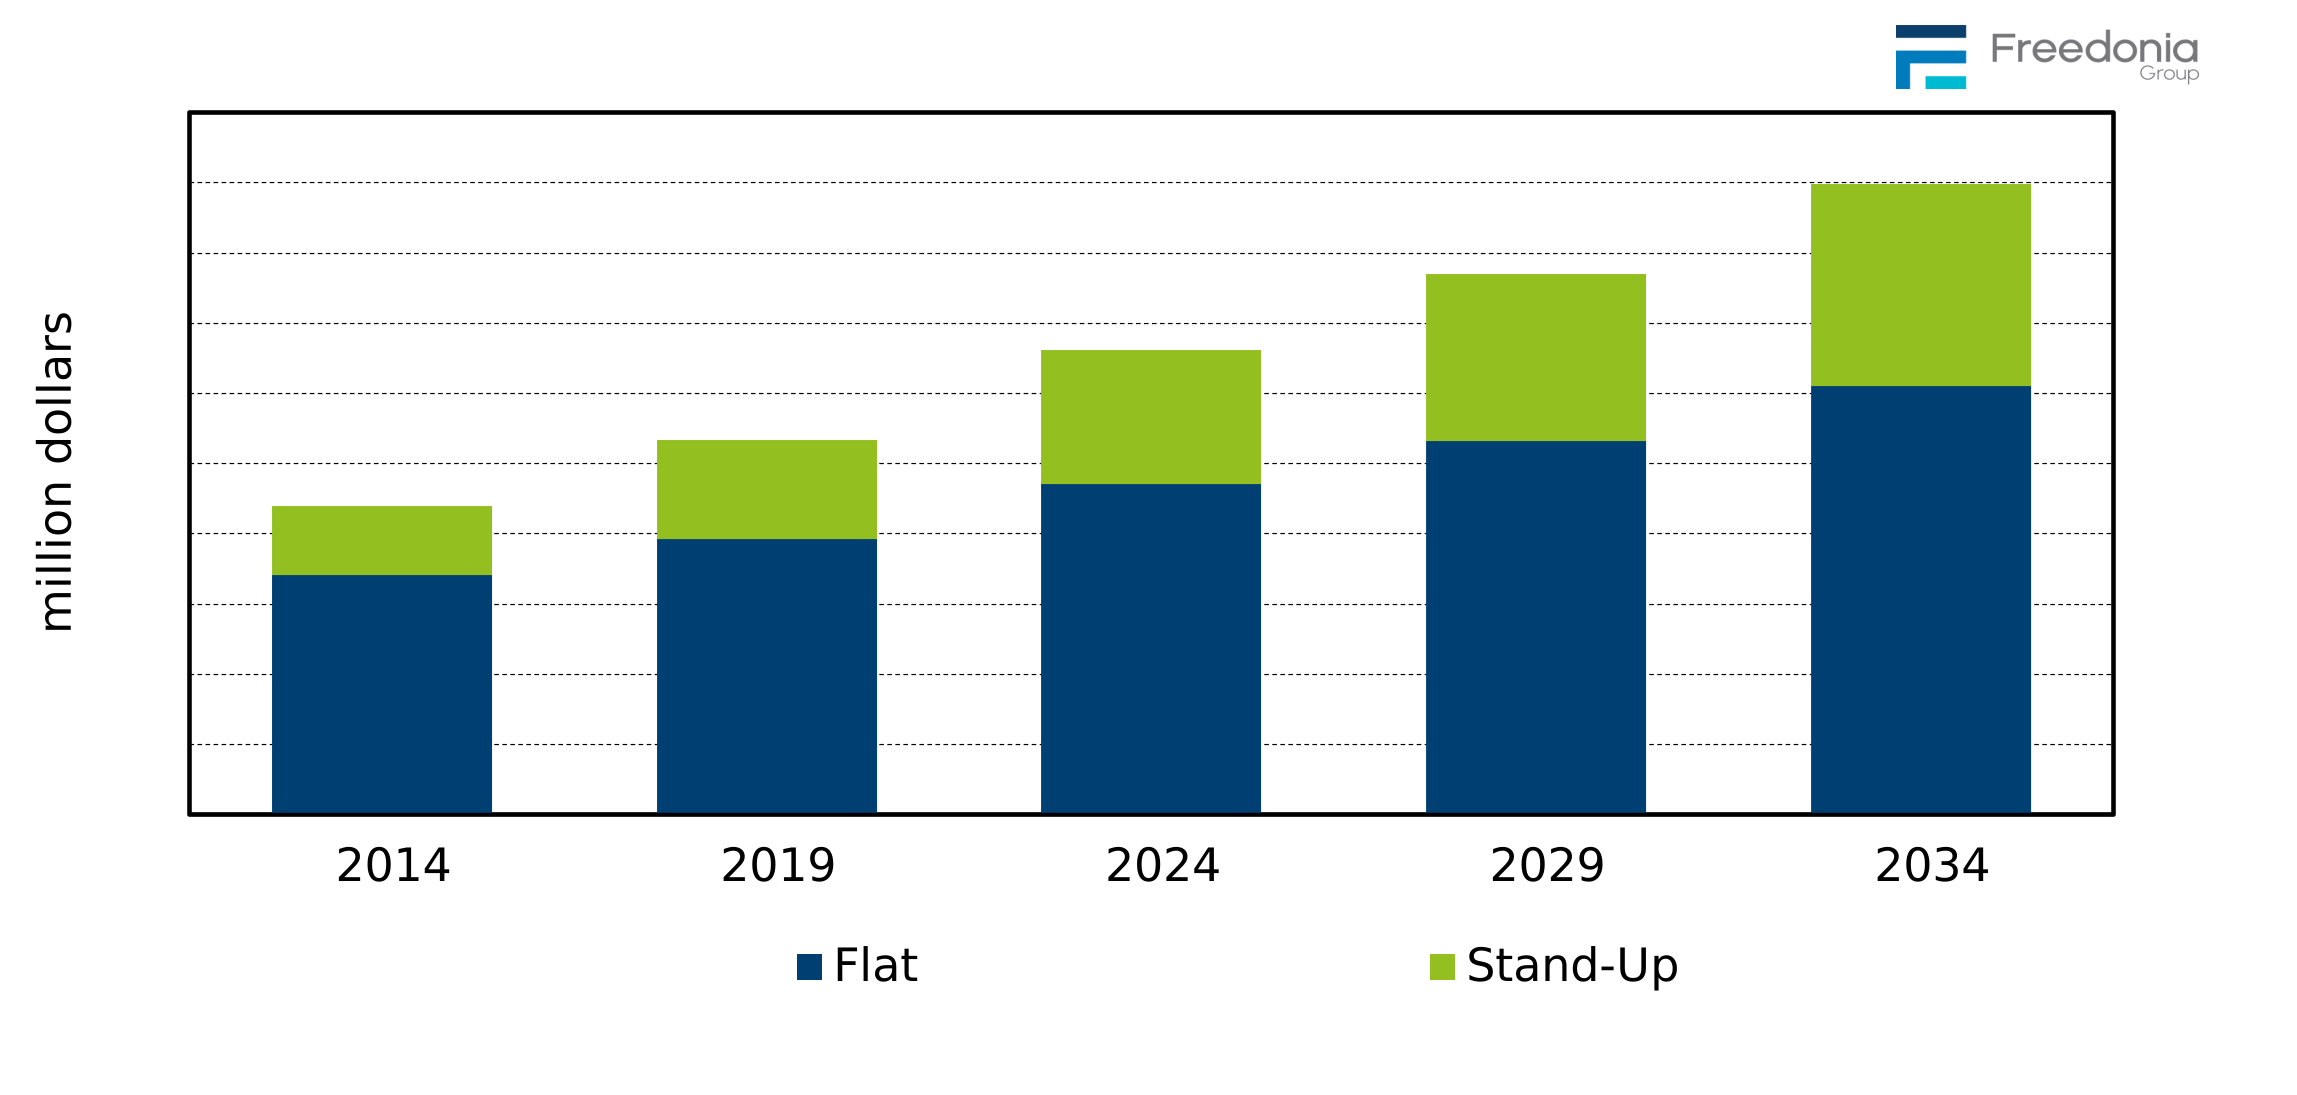
- Figure 3-3. Pouch Demand by Product Type, 2014, 2019, 2024, 2029, &2034 (million dollars)
- Production Methods
- Demand by Production Method
- Table | Pouch Demand by Production Method, 2014, 2019, 2024, 2029, &2034 (million dollars)
- Form-Fill-Seal (FFS) Pouches
- Figure 3-4. Form-Fill-Seal Pouch Production
- Other Pouch Production Methods
- Figure 3-5. Other Pouch Production Methods: Product Examples
- Demand by Production Method
- Market Category Overview (Food vs. Nonfood)
- Table | Pouch Demand by Market Sector: Food & Beverage vs. Nonfood, 2014, 2019, 2024, 2029, &2034 (million d
- Table | Annual Pouch Demand by Market Sector: Food & Beverage vs. Nonfood, 2021 - 2028 (million units and mi
- Pricing & Inflation
- Table | Pouch Prices by Product Type, 2014, 2019, 2024, 2029, &2034 (cents per unit)
- Table | Annual Pouch Prices by Product Type, 2020 - 2027 (cents per unit)
- Figure 3-6. Pouch Prices by Product, 2014 - 2034 (cents per unit)
- Study Scope
- Factors Impacting Demand for Pouches
- Food & Beverage Industry Outlook
- Figure 4-1. Food & Beverage Shipments, 2014, 2019, 2024, 2029, &2034 (billion dollars)
- Technology Trends
- Pouch Film Innovation
- Barrier Technology
- Machinery & Production Developments
- Sustainability Initiatives
- Recycling & Recycled Content
- Biobased Resins
- Extended Producer Responsibility (EPR)
- Consumer Preferences
- Sustainability
- Table | Consumer Insights: Packaging Sustainability, 2024 (% of total respondents)
- Paper Versus Plastic
- Table | Consumer Insights: Paper vs. Plastic, 2024 (% of total respondents)
- Packaging Features
- Table | Consumer Insights: Packaging Features, 2024 (% of total respondents)
- Consumer Awareness Regarding Packaging
- Table | Consumer Insights: Awareness of Packaging, "Packaging is an Important Factor to Me When I Make My Gr
- Sustainability
- Food & Beverage Industry Outlook
- Trends in Pouch Features
- Product Features Overview
- Figure 5-1. Pouch Feature Penetration Rates, 2014, 2019, 2024, 2029, &2034 (% total value)
- Resealable Pouches
- Product Description
- Figure 5-2. Resealable Pouches: Product Examples
- Demand by Market
- Table | Resealable Pouch Demand by Market, 2014, 2019, 2024, 2029, &2034 (million dollars)
- Table | Resealable Food & Beverage Pouch Demand by Application, 2014, 2019, 2024, 2029, &2034 (million dolla
- Table | Resealable Nonfood Pouch Demand by Application, 2014, 2019, 2024, 2029, &2034 (million dollars)
- Product Description
- Vacuum Pouches
- Product Description
- Figure 5-3. Vacuum Pouches: Product Examples
- Demand by Market
- Table | Vacuum Pouch Demand by Market, 2014, 2019, 2024, 2029, &2034 (million dollars)
- Table | Vacuum Food & Beverage Pouch Demand by Application, 2014, 2019, 2024, 2029, &2034 (million dollars)
- Table | Vacuum Nonfood Pouch Demand by Application, 2014, 2019, 2024, 2029, &2034 (million dollars)
- Product Description
- Spouted Pouches
- Product Description
- Figure 5-4. Spouted Pouches: Product Examples
- Demand by Market
- Table | Spouted Pouch Demand by Market, 2014, 2019, 2024, 2029, &2034 (million dollars)
- Table | Spouted Food & Beverage Pouch Demand by Application, 2014, 2019, 2024, 2029, &2034 (million dollars)
- Table | Spouted Nonfood Pouch Demand by Application, 2014, 2019, 2024, 2029, &2034 (million dollars)
- Product Description
- Retort Pouches
- Product Description
- Figure 5-5. Retort Pouches: Product Examples
- Demand by Market
- Table | Retort Pouch Demand by Market, 2014, 2019, 2024, 2029, &2034 (million dollars)
- Table | Retort Food & Beverage Pouch Demand by Application, 2014, 2019, 2024, 2029, &2034 (million dollars)
- Table | Retort Nonfood Pouch Demand by Application, 2014, 2019, 2024, 2029, &2034 (million dollars)
- Product Description
- Shaped Pouches
- Product Description
- Figure 5-6. Shaped Pouches: Product Examples
- Demand by Market
- Table | Shaped Pouch Demand by Market, 2014, 2019, 2024, 2029, &2034 (million dollars)
- Product Description
- Aseptic Pouches
- Product Description
- Figure 5-7. Aseptic Pouches: Product Examples
- Demand by Market
- Table | Aseptic Pouch Demand by Market, 2014, 2019, 2024, 2029, &2034 (million dollars)
- Table | Aseptic Food & Beverage Pouch Demand by Application, 2014, 2019, 2024, 2029, &2034 (million dollars)
- Product Description
- Stick Pouches
- Product Description
- Figure 5-8. Stick Pouches: Product Examples
- Demand by Market
- Table | Stick Pouch Demand by Market, 2014, 2019, 2024, 2029, &2034 (million dollars)
- Table | Stick Food & Beverage Pouch Demand by Application, 2014, 2019, 2024, 2029, &2034 (million dollars)
- Table | Stick Nonfood Pouch Demand by Application, 2014, 2019, 2024, 2029, &2034 (million dollars)
- Product Description
- Product Features Overview
- Flat Pouches (Pillow & Side Seal Pouches)
- Scope & Product Description
- Figure 6-1. Flat Pouches: Product Examples
- Product Types
- Demand by Type
- Table | Flat Pouch Demand by Type, 2014, 2019, 2024, 2029, &2034 (million dollars & million units)
- Figure 6-2. Flat Pouch Demand by Type, 2014, 2019, 2024, 2029, &2034 (million dollars)
- Pillow (Back or T-Seal)
- Table | Pillow Pouch Demand, 2014, 2019, 2024, 2029, &2034 (million dollars & million units)
- Figure 6-3. Pillow Pouch Applications
- Four-Side Seal
- Table | Four-Side-Seal Pouch Demand, 2014, 2019, 2024, 2029, &2034 (million dollars & million units)
- Figure 6-4. Four-Side Seal Pouch Applications
- Three-Side Seal
- Table | Three-Side Seal Pouch Demand, 2014, 2019, 2024, 2029, &2034 (million dollars & million units)
- Figure 6-5. Three-Side Seal Pouch Applications
- Demand by Type
- Markets
- Demand by Market
- Table | Flat Pouch Demand by Market, 2014, 2019, 2024, 2029, &2034 (million dollars)
- Food & Beverage Markets
- Table | Food & Beverage Flat Pouch Demand by Application, 2014, 2019, 2024, 2029, &2034 (million dollars)
- Nonfood Markets
- Table | Nonfood Flat Pouch Demand by Application, 2014, 2019, 2024, 2029, &2034 (million dollars)
- Demand by Market
- Trends in Product Features
- Figure 6-6. Flat Pouch Demand by Feature, 2014, 2019, 2024, 2029, &2034 (% total value)
- Scope & Product Description
- Stand-Up Pouches
- Scope & Product Description
- Figure 7-1. Stand-Up Pouch Types
- Demand by Product Type
- Table | Stand-Up Pouch Demand by Type, 2014, 2019, 2024, 2029, &2034 (million dollars & million units)
- Figure 7-2. Stand-Up Pouch Demand by Type, 2014, 2019, 2024, 2029, &2034 (million dollars)
- Markets
- Demand by Market
- Table | Stand-Up Pouch Demand by Market, 2014, 2019, 2024, 2029, &2034 (million dollars)
- Food & Beverage Markets
- Table | Food & Beverage Stand-Up Pouch Demand by Application, 2014, 2019, 2024, 2029, &2034 (million dollars
- Figure 7-3. Food & Beverage Markets for Stand-Up Pouches, 2014, 2019, 2024, 2029, &2034 (million dol
- Nonfood Markets
- Table | Nonfood Stand-Up Pouch Demand by Application, 2014, 2019, 2024, 2029, &2034 (million dollars)
- Figure 7-4. Nonfood Stand-Up Pouches by Application, 2014, 2019, 2024, 2029, &2034 (million dollars)
- Demand by Market
- Trends in Product Features
- Table | Stand-Up Pouch Demand by Feature, 2014, 2019, 2024, 2029, &2034 (million dollars)
- Figure 7-5. Stand-Up Pouch Demand by Feature, 2014, 2019, 2024, 2029, &2034 (% total value)
- Scope & Product Description
- Food & Beverage Markets
- Market Scope
- Figure 8-1. Food & Beverage Pouches: Product Examples
- Demand by Product Type
- Table | Food & Beverage Pouch Demand by Product Type, 2014, 2019, 2024, 2029, &2034 (million dollars)
- Demand by Application
- Table | Food & Beverage Pouch Demand: Food vs. Beverage, 2014, 2019, 2024, 2029, &2034 (million dollars & mi
- Food
- Demand by Product Type & Application
- Table | Food Pouch Demand by Product Type & Application, 2014, 2019, 2024, 2029, &2034 (million dollars)
- Savory Snacks
- Table | Savory Snack Pouch Demand by Product Type & Application, 2014, 2019, 2024, 2029, &2034 (million doll
- Candy & Confections
- Table | Candy & Confection Pouch Demand by Product Type, 2014, 2019, 2024, 2029, &2034 (million dollars & mi
- Baked Goods
- Table | Baked Goods Pouch Demand by Product Type, 2014, 2019, 2024, 2029, &2034 (million dollars & million u
- Processed Fruits & Vegetables
- Table | Processed Fruits & Vegetables Pouch Demand by Product Type, 2014, 2019, 2024, 2029, &2034 (million d
- Fresh Produce
- Table | Fresh Produce Pouch Demand by Product Type, 2014, 2019, 2024, 2029, &2034 (million dollars & million
- Dairy
- Table | Dairy Pouch Demand by Product, 2014, 2019, 2024, 2029, &2034 (million dollars & million units)
- Meat, Poultry, &Seafood
- Table | Meat, Poultry, &Seafood Pouch Demand by Product Type, 2014, 2019, 2024, 2029, &2034 (million dollars
- Sauces & Condiments
- Table | Sauce & Condiment Pouch Demand by Product Type, 2014, 2019, 2024, 2029, &2034 (million dollars & mil
- Prepared Foods
- Table | Prepared Foods Pouch Demand by Product Type, 2014, 2019, 2024, 2029, &2034 (million dollars & millio
- Other Foods
- Table | Other Food Pouch Demand by Product Type, 2014, 2019, 2024, 2029, &2034 (million dollars & million un
- Table | Other Food Pouch Demand by Application, 2014, 2019, 2024, 2029, &2034 (million dollars)
- Demand by Product Type & Application
- Beverages
- Demand by Product Type & Application
- Table | Beverage Pouch Demand by Product Type & Application, 2014, 2019, 2024, 2029, &2034 (million dollars
- Juices & Fruit Drinks
- Table | Juice & Fruit Drink Pouch Demand by Product Type, 2014, 2019, 2024, 2029, &2034 (million dollars & m
- Other Beverages
- Table | Other Beverage Pouch Demand by Product Type & Application, 2014, 2019, 2024, 2029, &2034 (million do
- Demand by Product Type & Application
- Market Scope
- Nonfood Markets
- Market Scope
- Figure 9-1. Nonfood Pouches: Product Examples
- Figure 9-2. Nonfood Pouches: Product Examples
- Demand by Product & Application
- Table | Nonfood Pouch Demand by Product Type & Application, 2014, 2019, 2024, 2029, &2034 (million dollars &
- Medical & Pharmaceutical
- Demand by Product Type & Application
- Table | Medical & Pharmaceutical Pouch Demand by Product Type & Market Sector, 2014, 2019, 2024, 2029, &2034
- Pharmaceuticals
- Table | Pharmaceutical Pouch Demand by Product Type, 2014, 2019, 2024, 2029, &2034 (million dollars & millio
- Medical Supplies & Instruments
- Table | Medical Supplies & Instrument Pouch Demand by Product Type, 2014, 2019, 2024, 2029, &2034 (million d
- Demand by Product Type & Application
- Consumer Products
- Demand by Product
- Table | Consumer Products Pouch Demand by Product Type, 2014, 2019, 2024, 2029, &2034 (million dollars & mil
- Demand by Application
- Table | Consumer Products Pouch Demand by Application, 2014, 2019, 2024, 2029, &2034 (million dollars & mill
- Lawn & Garden Products
- Soap & Cleaning Products
- Wipes
- Personal Care (Cosmetics & Toiletries)
- Other Consumer Products
- Demand by Product
- Pet Food & Treats
- Table | Pet Food & Treat Pouch Demand by Product Type, 2014, 2019, 2024, 2029, &2034 (million dollars & mill
- Industrial & Other Nonfood Markets
- Table | Industrial & Other Nonfood Pouch Demand by Product Type, 2014, 2019, 2024, 2029, &2034 (million doll
- Market Scope
- Industry Structure
- Key Findings & Industry Composition
- Table | US Merchant Pouch Sales by Company, 2024 (million dollars)
- Merchant vs. Captive Production
- Table | Pouch Demand by Producer Type, 2014, 2019, 2024, 2029, &2034 (million dollars)
- Market Share
- Figure 10-1. US Merchant Pouch Market Share by Company, 2024 (billion dollars)
- Figure 10-2. US Merchant Pouch Market: Leading Supplier, 2024
- Figure 10-3. US Merchant Pouch Market: Second Leading Supplier, 2024
- Figure 10-4. US Merchant Pouch Market: Third Leading Supplier, 2024
- Figure 10-5. US Merchant Pouch Market: Co-Fourth Leading Supplier, 2024
- Figure 10-6. US Merchant Pouch Market: Co-Fourth Leading Supplier, 2024
- Mergers & Acquisitions
- Table | Selected Mergers & Acquisitions
- List of Industry Participants
- Table | Selected Industry Participants
- Key Findings & Industry Composition
- Appendix
- Report Details
- Table | Relevant HS Codes
- Table | Relevant Industry Codes
- Definitions
- Abbreviations
- Table | Abbreviations Used in This Study
- Freedonia Methodology
- Study-Specific Methodology
- Data Changes from Previous Version
- Sources
- Associations & Agencies
- Related Studies & Reports
- Macroeconomic Assumptions
- Economic Environment
- Table | Macroeconomic Indicators, 2014, 2019, 2024, 2029, &2034 (billion 2017 dollars)
- Demographic Trends
- Table | Population & Households, 2014, 2019, 2024, 2029, &2034 (million persons)
- Consumer Spending
- Table | Personal Consumption Expenditures, 2014, 2019, 2024, 2029, &2034 (billion 2017 dollars)
- Economic Environment
- Report Details
For the purposes of this Freedonia report, pouches are defined as single-use flexible packaging containers that are generally sealed on all sides and do not require a separate closure to remain sealed until the time of purchase. Pouches can be made from a variety of materials; these include plastic film, paper, and aluminum foil.
In 2024 demand for pouches was over $13 billion.
The five leading suppliers to the US pouch market include Amcor, Printpack, Sonoco Products, ProAmpac, and SEE.