Table of Contents
1. Executive Summary
2. Overview
Study Scope
Historical Trends
Impact of COVID-19 Pandemic
Demand Trends
Drivers & Restraints
Demand by Product Type
Demand by Market
Production & Foreign Trade
Shipments
Imports
Exports
Pricing Patterns
Regulatory Issues
Air & Noise Pollution
Consumer Safety
Drought & Water Shortages
Sustainability Initiatives
3. Power Sources
Demand by Power Source
Engine-Driven Equipment
Electric-Powered Equipment
Demand by Product
Corded Lawn & Garden Equipment
Cordless (Battery-Powered) Lawn & Garden Equipment
Consumer Opinions
Electric vs. Other Power Sources
Reasons for Buying Electric
4. Lawn Mowers
Scope & Product Description
Production & Foreign Trade
Demand by Type
Demand by Market
Demand by Power Source
Riding Lawn Mowers
Supply & Demand
Demand by Type
Front-Engine Riding Lawn Mowers (Lawn Tractors)
Rear-Engine Riding Lawn Mowers
Zero Turn Riding Lawn Mowers (ZTR)
Demand by Power Source
Suppliers
Walk Behind Lawn Mowers
Supply & Demand
Demand by Type (Self-Propelled vs. Push)
Demand by Power Source
Suppliers
Robotic Lawn Mowers
Supply & Demand
Sales Outlook
Suppliers
5. Turf & Grounds Mowers
Scope & Product Description
Production & Foreign Trade
Demand by Type
Demand by Market
Demand by Power Source
Riding Turf & Grounds Mowers
Supply & Demand
Demand by Type (Rotary or Reel)
Zero Turn Riding Turf & Grounds Mowers
Walk Behind Turf & Grounds Mowers
Other Turf & Grounds Mowers (Stand-On, Trimmer Mowers, Tow-Behind)
Suppliers
6. Trimmers & Edgers
Scope & Product Description
Production & Foreign Trade
Demand by Type
Demand by Market
Wire Blade Trimmers & Edgers
Fixed Blade Trimmers & Edgers
Demand by Power Source
Suppliers
7. Garden Tractors & Rotary Tillers
Scope & Product Description
Production & Foreign Trade
Demand by Type
Demand by Market
Garden Tractors
Rotary Tillers
Suppliers
8. Chainsaws
Scope & Product Description
Supply & Demand
Demand by Market
Demand by Power Source
Suppliers
9. Blowers, Vacuums, & Sweepers
Scope & Product Description
Supply & Demand
Demand by Market
Demand by Power Source
Suppliers
10. Snow Blowers
Scope & Product Description
Supply & Demand
Demand by Type
Demand by Market
Dual- & Three-Stage Snow Blowers
Single-Stage Snow Blowers
Weather & Climate Considerations
Suppliers
11. Other Equipment & Parts
Other Power Lawn & Garden Equipment
Scope & Product Description
Supply & Demand
Demand by Market
Suppliers
Parts & Attachments
Scope & Product Description
Supply & Demand
Demand by Market
Suppliers
12. Residential Market
Market Scope
Demand by Product
Consumer Trends
Lawn Maintenance & Gardening Insights
Average Lot Size & Outdoor Space Trends
Who Performs Lawn & Garden Work at Home?
Ownership of Power Lawn & Garden Equipment
Power Lawn & Garden Equipment Purchase Patterns
Power Lawn & Garden Equipment Purchasing Occasions
Factors in Selecting Power Lawn & Garden Equipment
Retail Outlets
Consumer Lawn & Garden Care Practices
Landscaping Services Preferences
Leading Suppliers
13. Commercial Markets
Market Scope
Demand by Product Type
Market Sectors
Demand by Market Sector
Landscaping Establishments
Golf Courses
Commercial & Government
Key Suppliers
14. Regions
Demand by Region
Northeast
Northeast: Power Lawn & Garden Equipment Demand
Northeast: Product Mix
Northeast: Regional Suppliers
Midwest
Midwest: Power Lawn & Garden Equipment Demand
Midwest: Product Mix
Midwest: Regional Suppliers
South
South: Power Lawn & Garden Equipment Demand
South: Product Mix
South: Regional Suppliers
West
West: Power Lawn & Garden Equipment Demand
West: Product Mix
West: Regional Suppliers
15. Suppliers & Market Share
Key Findings & Industry Composition
Market Share
Mergers & Acquisitions
List of Industry Participants
16. Appendix
Scope
Definitions
Abbreviations
Freedonia Methodology
Study-Specific Methodology
Sources
Associations & Agencies
Related Studies & Reports
Macroeconomic Assumptions
Economic Environment
Demographic Trends
Housing Stock
List of Tables
2. Overview
Table 2-1 | Power Lawn & Garden Equipment Demand, 2009 - 2019
Table 2-2 | Annual Power Lawn & Garden Equipment Demand by Product, 2019 - 2021 (million dollars)
Table 2-3 | Annual Power Lawn & Garden Equipment Demand by Market, 2019 - 2021 (million dollars)
Table 2-4 | Power Lawn & Garden Equipment Demand by Product, 2009 - 2029 (million dollars)
Table 2-5 | Power Lawn & Garden Equipment Demand by Market, 2009 - 2029 (million dollars)
Table 2-6 | Power Lawn & Garden Supply & Demand, 2009 - 2029 (million dollars)
Table 2-7 | Power Lawn & Garden Equipment Pricing, 2009 - 2029 (dollars per unit)
3. Power Sources
Table 3-1 | Power Lawn & Garden Equipment Demand by Power Source, 2009 - 2029 (million dollar)
Table 3-2 | Internal Combustion Engine-Powered Lawn & Garden Equipment Demand by Product, 2009 - 2029 (million dollars)
Table 3-3 | Electric-Powered Lawn & Garden Equipment Demand by Product & Type, 2009 - 2029 (million dollars)
Table 3-4 | Corded Power Lawn & Garden Equipment by Product, 2009 - 2029 (million dollars)
Table 3-5 | Cordless (Battery-Powered) Lawn & Garden Equipment Demand by Product, 2009 - 2029 (million dollars)
4. Lawn Mowers
Table 4-1 | Lawn Mower Supply & Demand by Product, 2009 - 2029 (million dollars)
Table 4-2 | Lawn Mower Demand by Type, 2009 - 2029 (million dollars & thousand units)
Table 4-3 | Lawn Mower Demand by Market, 2009 - 2029 (million dollars)
Table 4-4 | Lawn Mower Demand by Power Source, 2009 - 2029 (million dollars)
Table 4-5 | Riding Lawn Mower Supply & Demand, 2009 - 2029 (million dollars & thousand units)
Table 4-6 | Riding Lawn Mower Demand by Type & Zero Turn Capability, 2009 - 2029 (million dollars)
Table 4-7 | Front-Engine Riding Lawn Mower Supply & Demand, 2009 - 2029 (million dollars & thousand units)
Table 4-8 | Rear-Engine Riding Lawn Mower Supply & Demand, 2009 - 2029 (million dollars & thousand units)
Table 4-9 | Riding Lawn Mower Demand by Power Source, 2009 - 2029 (million dollars)
Table 4-10 | Selected Riding Lawn Mower Suppliers
Table 4-11 | Walk Behind Lawn Mower Supply & Demand, 2009 - 2029 (million dollars & thousand units)
Table 4-12 | Walk Behind Lawn Mower Demand by Type, 2009 - 2029 (million dollars)
Table 4-13 | Walk Behind Lawn Mower Demand by Power Source, 2009 - 2029 (million dollars)
Table 4-14 | Selected Walk Behind Lawn Mower Suppliers
Table 4-15 | Robotic Lawn Mower Demand, 2009 - 2029 (million dollars & thousand units)
5. Turf & Grounds Mowers
Table 5-1 | Turf & Grounds Mower Supply & Demand by Type, 2009 - 2029 (million dollars)
Table 5-2 | Turf & Grounds Mower Demand by Type, 2009 - 2029 (million dollars & thousand units)
Table 5-3 | Turf & Grounds Mower Demand by Market, 2009 - 2029 (million dollars)
Table 5-4 | Turf & Grounds Mower Demand by Power Source, 2009 - 2029 (million dollars)
Table 5-5 | Riding Turf & Grounds Mower Supply & Demand, 2009 - 2029 (million dollars & thousand units)
Table 5-6 | Riding Turf & Grounds Mower Demand by Type & Zero Turn Capability, 2009 - 2029 (million dollars)
Table 5-7 | Walk Behind Turf & Grounds Mower Supply & Demand, 2009 - 2029 (million dollars & thousand units)
Table 5-8 | Other Turf & Grounds Mowers Supply & Demand, 2009 - 2029 (million dollars & thousand units)
Table 5-9 | Selected Turf & Grounds Mower Suppliers
6. Trimmers & Edgers
Table 6-1 | Trimmer & Edger Supply & Demand by Type, 2009 - 2029 (million dollars)
Table 6-2 | Trimmer & Edger Demand by Type, 2009 - 2029 (million dollars & thousand units)
Table 6-3 | Trimmer & Edger Demand by Market, 2009 - 2029 (million dollars)
Table 6-4 | Wire Blade Trimmer & Edger Supply & Demand, 2009 - 2029 (million dollars & thousand units)
Table 6-5 | Fixed Blade Trimmer & Edger Supply & Demand, 2009 - 2029 (million dollars & thousand units)
Table 6-6 | Trimmer & Edger Demand by Power Source, 2009 - 2029 (million dollars)
Table 6-7 | Selected Trimmer & Edger Suppliers
7. Garden Tractors & Rotary Tillers
Table 7-1 | Garden Tractor & Rotary Tiller Supply & Demand by Type, 2009 - 2029 (million dollars)
Table 7-2 | Garden Tractor & Rotary Tiller Demand by Type, 2009 - 2029 (million dollars & thousand units)
Table 7-3 | Garden Tractor & Rotary Tiller Demand by Market, 2009 - 2029 (million dollars)
Table 7-4 | Garden Tractor Supply & Demand by Type, 2009 - 2029 (million dollars & thousand units)
Table 7-5 | Rotary Tiller Supply & Demand, 2009 - 2029 (million dollars & thousand units)
Table 7-6 | Selected Garden Tractor & Rotary Tiller Suppliers
8. Chainsaws
Table 8-1 | Chainsaw Supply & Demand, 2009 - 2029 (million dollars)
Table 8-2 | Chainsaw Demand by Market, 2009 - 2029 (million dollars & thousand units)
Table 8-3 | Chainsaw Demand by Power Source, 2009 - 2029 (million dollars)
Table 8-4 | Selected Chainsaw Suppliers
9. Blowers, Vacuums, & Sweepers
Table 9-1 | Blower, Vacuum, & Sweeper Supply & Demand, 2009 - 2029 (million dollars)
Table 9-2 | Blower, Vacuum, & Sweeper Demand by Market, 2009 - 2029 (million dollars & thousand units)
Table 9-3 | Blower, Vacuum, & Sweeper Demand by Power Source, 2009 - 2029 (million dollars)
Table 9-4 | Selected Blower, Vacuum, & Sweeper Suppliers
10. Snow Blowers
Table 10-1 | Snow Blower Supply & Demand, 2009 - 2029 (million dollars)
Table 10-2 | Snow Blower Demand by Type, 2009 - 2029 (million dollars & thousand units)
Table 10-3 | Snow Blower Demand by Market, 2009 - 2029 (million dollars)
Table 10-4 | Dual- & Three-Stage Snow Blower Supply & Demand, 2009 - 2029 (million dollars & thousand units)
Table 10-5 | Single-Stage Snow Blower Supply & Demand, 2009 - 2029 (million dollars & thousand units)
Table 10-6 | Selected Snow Blower Suppliers
11. Other Equipment & Parts
Table 11-1 | Other Power Lawn & Garden Equipment Supply & Demand by Type, 2009 - 2029 (million dollars & thousand units)
Table 11-2 | Other Power Lawn & Garden Equipment Demand by Market, 2009 - 2029 (million dollars & thousand units)
Table 11-3 | Selected Suppliers of Other Power Lawn & Garden Equipment
Table 11-4 | Power Lawn & Garden Parts & Attachments Supply & Demand, 2009 - 2029 (million dollars)
Table 11-5 | Power Lawn & Garden Parts & Attachments Demand by Market, 2009 - 2029 (million dollars)
Table 11-6 | Selected Suppliers of Power Lawn & Garden Parts & Attachments
12. Residential Market
Table 12-1 | Residential Power Lawn & Garden Equipment Demand by Product, 2009 - 2029 (million dollars)
Table 12-2 | "I Enjoy Caring for My Lawn & Garden" by Gender & Age Bracket, 2020 (percent of those who have a yard, lawn, or garden space)
Table 12-3 | Lot Size Owned by Urban vs. Rural Setting, 2020 (percent of those who indicate they own the land around their home)
Table 12-4 | Who Performs Lawn & Garden Maintenance Tasks by Urban vs. Rural Setting, 2020 (percent of those who have a yard, lawn, or garden space)
Table 12-5 | "Do You Own Power Lawn & Garden Equipment?" by Gender, Age Bracket, Urban vs. Rural Setting, & US Region, 2020 (percent of total consumers)
Table 12-6 | Power Lawn & Garden Equipment Ownership by Type & Urban vs. Rural Setting, 2020 (percent of respondents who own power lawn & garden equipment of any type)
Table 12-7 | "Did You Buy Power Lawn & Garden Equipment in the Past 12 Months?" by Gender, Age Bracket, Urban vs. Rural Setting, & US Region, 2020 (percent of respondents who own power lawn & garden equipment)
Table 12-8 | "Which Type of Power Lawn & Garden Equipment Did You Buy in the Last 12 Months?", 2020 (percent of those who bought power lawn & garden equipment in the last 12 months)
Table 12-9 | "What Was Your Primary Reason for Buying Your Power Lawn & Garden Equipment?", 2020 (percent of those who bought power lawn & garden equipment in the past 12 months)
Table 12-10 | "Where Did You Purchase Your Power Lawn & Garden Equipment?", 2020 (percent of those who bought in the last 12 months)
Table 12-11 | "Does Your Household Have a Grass Lawn That Needs Mowing?" by Type of Residence & Residence Ownership, 2020 (percent of respondents)
Table 12-12 | Lawn Mowing Consumer Insight by Gender & Age Group, 2020 (percent of respondents who agree)
Table 12-13 | Consumer Insights on Select Landscaping Services Options by Gender & Age Group, 2020 (percent respondents who agree among those who have a yard, lawn, or garden space at home)
13. Commercial Markets
Table 13-1 | Commercial Power Lawn & Garden Equipment Demand by Product, 2009 - 2029 (million dollars)
Table 13-2 | Commercial Power Lawn & Garden Equipment Demand by Market, 2009 - 2029 (million dollars)
Table 13-3 | Landscaping Establishments Power Lawn & Garden Equipment Demand by Product, 2009 - 2029 (million dollars)
Table 13-4 | Golf Course Power Lawn & Garden Equipment Demand by Product, 2009 - 2029 (million dollars)
Table 13-5 | Government & Other Commercial Power Lawn & Garden Equipment Demand by Product, 2009 - 2029 (million dollars)
14. Regions
Table 14-1 | Power Lawn & Garden Equipment Demand by Region, 2009 - 2029 (million dollars)
Table 14-2 | Northeast: Power Lawn & Garden Equipment Demand by Market, 2009 - 2029 (million dollars)
Table 14-3 | Northeast: Selected Power Lawn & Garden Suppliers
Table 14-4 | Midwest: Power Lawn & Garden Equipment Demand by Market, 2009 - 2029 (million dollars)
Table 14-5 | Midwest: Selected Power Lawn & Garden Suppliers
Table 14-6 | South: Power Lawn & Garden Equipment Demand by Market, 2009 - 2029 (million dollars)
Table 14-7 | South: Selected Power Lawn & Garden Suppliers
Table 14-8 | West: Power Lawn & Garden Equipment Demand by Market, 2009 - 2029 (million dollars)
Table 14-9 | West: Selected Power Lawn & Garden Suppliers
15. Suppliers & Market Share
Table 15-1 | US Power Lawn & Garden Equipment Sales by Company, 2019 (million dollars)
Table 15-2 | Selected Mergers & Acquisitions
Table 15-3 | Selected Industry Participants
16. Appendix
Table 16-1 | Study Scope: US Geographic Regions & Subregions
Table 16-2 | Relevant Industry Codes
Table 16-3 | Relevant HS Codes
Table 16-4 | Abbreviations & Acronyms Used in Study
Table 16-5 | Macroeconomic Indicators, 2009 - 2029 (billion 2012 dollars)
Table 16-6 | Population & Households, 2009 - 2029 (million persons)
Table 16-7 | Housing Stock by Type, 2009 - 2029 (million units)
List of Figures
1. Executive Summary
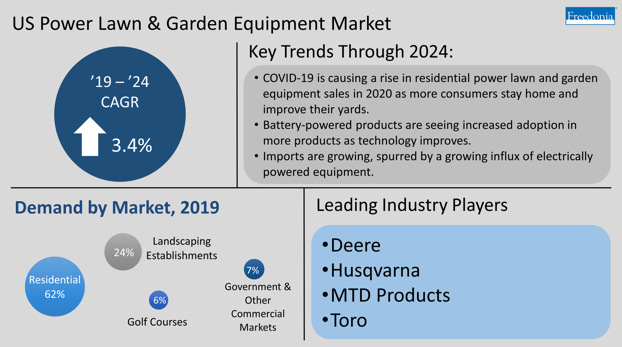
Figure 1-1 | US Power Lawn & Garden Equipment Market
2. Overview
Figure 2-1 | Power Lawn & Garden Equipment Demand, 2004 - 2019 (million dollars)
Figure 2-2 | Power Lawn & Garden Equipment Demand: % Annual Change by Market, 2018 - 2021 (million dollars)
Figure 2-3 | Power Lawn & Garden Equipment Demand by Product, 2009 - 2024 (million dollars)
Figure 2-4 | Power Lawn & Garden Trade, 2009 - 2019 (million dollars)
Figure 2-5 | Power Lawn & Garden Equipment Imports: Share by Product, 2019 (billion dollars)
Figure 2-6 | Power Lawn & Garden Equipment Exports: Share by Product, 2019 (billion dollars)
Figure 2-7 | Power Lawn & Garden Equipment Pricing, 2009 - 2024 (dollars per unit)
3. Power Sources
Figure 3-1 | Power Lawn & Garden Equipment Demand by Power Source, 2009 - 2024 (million dollar)
Figure 3-2 | Electric-Powered Power Lawn & Garden Equipment Demand Share by Product, 2009 - 2024 (million dollars)
Figure 3-3 | Corded Power Lawn & Garden Equipment Demand by Product, 2009 - 2024 (million dollars)
Figure 3-4 | Cordless (Battery-Powered) Lawn & Garden Equipment Demand by Product, 2009 - 2024 (million dollars)
Figure 3-5 | Consumer Insights on Lawn & Garden Equipment Power Sources, 2020 (percent of consumers who own power lawn & garden equipment)
Figure 3-6 | "Why Did You Select an Electric Version of Lawn & Garden Equipment?", 2020 (percent of consumers who own electric power lawn & garden equipment)
4. Lawn Mowers
Figure 4-1 | Lawn Mowers: Product Examples
Figure 4-2 | Lawn Mower Demand, 2009 - 2024 (million dollars)
Figure 4-3 | Lawn Mower Demand Share: Corded vs. Cordless, 2009 - 2024
Figure 4-4 | Zero Turn as a Share of Riding Lawn Mower Demand, 2009 - 2024 (million dollars)
Figure 4-5 | Walk Behind Lawn Mower Demand Share: Corded vs. Cordless, 2009 - 2024
5. Turf & Grounds Mowers
Figure 5-1 | Turf & Grounds Mowers: Product Examples
Figure 5-2 | Turf & Grounds Mower Demand, 2009 - 2024 (million dollars)
Figure 5-3 | Turf & Grounds Mower Demand by Type, 2009 - 2024 (million dollars)
Figure 5-4 | Zero Turn Share of Riding Turf & Ground Mower Demand, 2009 - 2024 (million dollars)
Figure 5-5 | Walk Behind Turf & Grounds Mower Demand Share: Corded vs. Cordless, 2009 - 2024
6. Trimmers & Edgers
Figure 6-1 | Trimmers & Edgers: Product Examples
Figure 6-2 | Trimmer & Edger Demand, 2009 - 2024 (million dollars)
Figure 6-3 | Trimmer & Edger Demand Share: Corded vs. Cordless, 2009 - 2024
7. Garden Tractors & Rotary Tillers
Figure 7-1 | Garden Tractors & Rotary Tillers: Product Examples
Figure 7-2 | Garden Tractor & Rotary Tiller Demand, 2009 - 2024 (million dollars)
8. Chainsaws
Figure 8-1 | Chainsaws: Product Examples
Figure 8-2 | Chainsaw Demand, 2009 - 2024 (million dollars)
Figure 8-3 | Chainsaw Demand Share: Corded vs. Cordless, 2009 - 2024
9. Blowers, Vacuums, & Sweepers
Figure 9-1 | Blowers, Vacuums, & Sweepers: Product Examples
Figure 9-2 | Blower, Vacuum, & Sweeper Demand, 2009 - 2024 (million dollars)
Figure 9-3 | Blower, Vacuum, & Sweeper Demand Share: Corded vs. Cordless, 2009 - 2024
10. Snow Blowers
Figure 10-1 | Snow Blowers: Product Examples
Figure 10-2 | Snow Blower Demand, 2009 - 2024 (million dollars)
11. Other Equipment & Parts
Figure 11-1 | Other Power Lawn & Garden Equipment: Product Examples
Figure 11-2 | Parts & Attachments: Product Examples
12. Residential Market
Figure 12-1 | Residential Power Lawn & Garden Equipment Demand by Product, 2009 - 2024 (million dollars)
Figure 12-2 | Lawn Maintenance & Gardening Participation Insights, 2020 (percent of those who have a yard, lawn, or garden space)
Figure 12-3 | Amount of Land Owned Around Homes, 2020 (percent of those who indicate they own the land around their home)
Figure 12-4 | "What Was the Most Important to You When Deciding Which Power Lawn & Garden Equipment to Buy?", 2020 (percent of those who bought power lawn & garden in the past year)
13. Commercial Markets
Figure 13-1 | Commercial Power Lawn & Garden Equipment Demand by Product, 2009 - 2024 (million dollars)
14. Regions
Figure 14-1 | Power Lawn & Garden Equipment Demand by Region, 2009 - 2024 (million dollars)
Figure 14-2 | Northeast: Power Lawn & Garden Equipment Demand Share by Product, 2019 (billion dollars)
Figure 14-3 | Midwest: Power Lawn & Garden Equipment Demand Share by Product, 2019 (billion dollars)
Figure 14-4 | South: Power Lawn & Garden Equipment Demand Share by Product, 2019 (billion dollars)
Figure 14-5 | West: Power Lawn & Garden Equipment Demand Share by Product, 2019 (billion dollars)
15. Suppliers & Market Share
Figure 15-1 | US Power Lawn & Garden Equipment Market Share by Company, 2019 (billion dollars)
Figure 15-2 | Power Lawn & Garden Equipment Market, 2019: Leading Supplier
Figure 15-3 | Power Lawn & Garden Equipment Market, 2019: Second Leading Supplier
Figure 15-4 | Power Lawn & Garden Equipment Market, 2019: Third Leading Supplier
Figure 15-5 | Power Lawn & Garden Equipment Market, 2019: Fourth Leading Supplier
16. Appendix
Figure 16-1 | Annual Growth in Real GDP, 2000 - 2019, Compared to 1980 - 2005 Average (percent)
Figure 16-2 | Annual Population Growth, 2004 - 2019 (percent)
Figure 16-3 | Housing Stock: Share by Year of Construction, 2019 (million units)
© by The Freedonia Group, a division of MarketResearch.com