Recreational Boating in the US by Product and Region, 11th Edition
While outboards have always held a significant portion of the market, consumer demand has expanded in recent years.
Free Sample Report
Request a free sample of this report and our team will email it to you.
Report Overview
Featuring 62 tables and 34 figures – now available in Excel and Powerpoint!Learn More
Personal Watercraft: The Rec Lite Movement
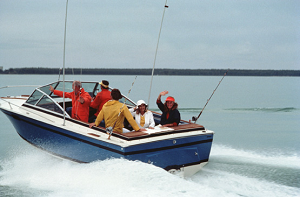
For most new boat buyers, price is an important consideration. Even a small vessel is a big investment. Hoping to relieve monetary stress and appeal to new demographics, manufacturers of personal watercraft have released entry-level models known as Rec Lite in recent years, including the Sea-Doo SPARK and the WaveRunner EX series. By offering a high performing vessel at a more affordable price, personal watercraft now appeal to a larger customer base.
Key Findings in the Recreational Boating Study:
Consumer Spending and Access to Credit Spur Boat Purchases
Years of steady improvement in the US economy have offered consumers the financial flexibility to purchase a first new boat or upgrade from an older vessel. Moreover, interest rates remain relatively low, making credit more affordable, and home values and equity are increasing, giving homeowners more value on which to finance luxury purchases. Looking forward, the health of the US economy will be vital to the boating industry’s growth.
Outboards Have Fueled the Boating Industry Recovery
As the industry continues to recover, outboard powerboats have steadily taken market share from other powerboats, particularly sterndrive. Moreover, the popularity of outboards has prevented inboards from reaching pre-recession shares of demand. While outboards have always held a significant portion of the market, consumer demand has expanded in recent years. Outboard motors are favored for their low price, performance, easy maintenance, and upgradability. They also allow for more room on the boat for activities. Moreover, many boat companies now offer multiple outboard engines, enabling their use in larger boats that require greater power.
Technology Has Made Boating Easier
Boats are increasingly augmented with features like joystick controls, digital throttles, virtual anchors, and digital dashboards. These innovations have allowed experienced boaters to focus more on their recreational activity. Furthermore, they provide novices with added confidence when making a first-time boat purchase.
Study Coverage
This study presents historical data (2007, 2012, and 2017) and forecasts for 2022 by product (recreational boats, propulsion systems, boating accessories) and by region (Northeast, Midwest, South, West) in units and US dollars. Recreational boats include outboard powerboats, inboard powerboats, sterndrive powerboats, personal watercraft, sailboats, and other types of boats. The study also evaluates key industry players, market shares and analysis of consumer survey data.
This study analyzes US demand for recreational boating by product and region. In the context of this study, “recreational boating” includes all of the products mentioned below, while “recreational boats” refers only to boats and personal watercraft. Products are separated into recreational boats and propulsion systems and accessories.
The recreational boat types broken out are:
- outboard powerboats
- inboard powerboats
- sterndrive powerboats
- personal watercraft
- sailboats
- other recreational boats, such as jet boats, canoes, and all other (e.g., inflatable boats, rowboats, and kayaks)
Outboards are further segmented by boat type (pontoon boats, fish and ski boats, bass boats, center console boats, runabouts, and other).
The propulsion systems and accessories broken out are:
- OEM outboard propulsions systems
- OEM inboard and sterndrive propulsion systems
- repower propulsion systems
- boating accessories (navigational and electronic, trailers, and other)
For the purposes of this study, propulsion systems are divided into two segments: OEM and repower. OEM includes propulsions systems that are factory installed or sold with a new boat in a package. Repower includes propulsion systems sold in the aftermarket.
Demand for recreational boating products is also segmented by the following US geographic regions:
- Northeast
- Midwest
- South
- West
Historical data for 2007, 2012, and 2017 and forecasts for 2022 are provided in current dollars (which are not adjusted to account for inflation) for demand, manufacturer’s shipments, and imports and exports for aggregate recreational boating products. Demand and current dollar shipment information is also given for each product classification at the manufacturers’ level (unless otherwise specified) and, for many key product categories, demand is also provided in unit terms.
For the purposes of this study, factory-installed propulsion systems or those sold in a package with a boat are considered separately from the vessels they power, except for personal watercraft and jet boats. This is primarily because boat owners are generally given an option for propulsion systems at the time of purchase. Additionally, the study covers propulsion systems sold in the aftermarket to repower vessels.
Data provided for accessories reflects only those items that are sold separately to the consumer in the aftermarket. Factory-installed accessories or those included in a boat package are considered with the boat or propulsion system.
- EXECUTIVE SUMMARY
- Figure 1-1 | Key Trends in the US Recreational Boating Market
- OVERVIEW
- Key Findings
- Figure 2-1 | Key Trends in Recreational Boating Products
- Recreational Boating Supply & Demand Overview
- Historical Trends
- Figure 2-2 | Recreational Boating Product Market, 2007 - 2022
- Supply & Demand Forecast
- Table | Recreational Boating Product Supply & Demand, 2007 - 2022
- Historical Trends
- Traditional Boat Owners and Efforts to Expand Base
- Traditional Boat Owner Profile
- Gender and Race Profile
- Table | Race and Gender of Consumers Whose Household Owns a Boat, 2017
- Age Trends
- Table | Age of Consumers Whose Household Owns a Boat, 2017
- Income Trends
- Table | Income of Households That Own a Boat, 2017
- Efforts to Expand Base
- Boating Activity Trends
- Boating Activity Trends Overview
- Fishing
- Figure 2-3 | Freshwater Fishing Demographic Profile
- Table | Race and Gender of Freshwater Fishing Participants
- Water Activities
- Table | Age of Water Activity Participants in Last 12 Months
- Figure 2-4 | Age of Water Activity Participants in Last 12 Months
- Recreational Boat Retail Sales
- Table | Recreational Boat Retail Sales, 2007 - 2022
- Recreational Boats in Use
- Table | Recreational Boats in Use by Type, 2007 - 2022
- Pricing
- Table | Selected Recreational Boat Prices, 2007 - 2022
- Figure 2-5 | Price Volatility for New Recreational Boats, 2007 - 2022
- Technology
- Technology Overview
- Engines & Engine Controls
- Figure 2-6 | SeaStar Solutions' Optimus 360 Joystick
- Electronics
- Figure 2-7 | Mercury Marine's VesselView Display
- Figure 2-8 | Humminbird's HELIX 10 CHIRP MEGA SI GPS G2N
- Figure 2-9 | Malibu's Surf Band
- Regulatory & Safety Issues
- Regulatory & Safety Overview
- Emissions & Noise Issues
- Wildlife & Environmental Protection Issues
- Safety Issues
- Global Outlook
- Trade
- Table | US Recreational Boating Foreign Trade, 2007 - 2022
- Key Findings
- RECREATIONAL BOATS
- Key Findings
- Figure 3-1 | Key Trends in Recreational Boats
- Supply & Demand by Boat Type
- Overview
- Supply & Demand Forecast
- Table | Recreational Boat Supply & Demand, 2007 - 2022
- Figure 3-2 | Demand for Recreational Boats: Volume & Value, 2017
- Outboard Powerboats
- Figure 3-3 | Outboard, Inboard, and Sterndrive Powerboats Volume Share Comparison, 2007 - 2022
- Table | Outboard Powerboat Supply & Demand, 2007 - 2022
- Table | Outboard Powerboat Demand by Product, 2007 - 2022
- Figure 3-4 | Outboard Powerboat Demand by Product, 2017 - 2022
- Table | Pontoon Boats Demand, 2007 - 2022
- Table | Fish & Ski Boats Demand, 2007 - 2022
- Table | Bass Boats Demand, 2007 - 2022
- Table | Center Console Boats Demand, 2007 - 2022
- Table | Runabouts Demand, 2007 - 2022
- Table | Other Boats Demand, 2007 - 2022
- Table | Selected Outboard Powerboat Producers
- Inboard Powerboats
- Table | Inboard Powerboat Supply & Demand, 2007 - 2022
- Figure 3-5 | Inboard Powerboat Volume Demand by Product, 2007 - 2017
- Table | Inboard Cabin Cruiser Supply & Demand, 2007 - 2022
- Table | Runabout & Other Inboard Powerboat Supply & Demand, 2007 - 2022
- Table | Selected Inboard Powerboat Producers
- Sterndrive Powerboats
- Table | Sterndrive Powerboat Supply & Demand, 2007 - 2022
- Figure 3-6 | Sterndrive Powerboat Volume Demand, 2007 - 2017
- Table | Selected Sterndrive Powerboat Producers
- Personal Watercraft
- Table | Personal Watercraft Regulatory & Safety Issues
- Table | Personal Watercraft Supply & Demand, 2007 - 2022
- Figure 3-7 | Personal Watercraft Market, 2007 - 2017
- Table | Selected Personal Watercraft Producers
- Sailboats
- Table | Sailboat Supply & Demand, 2007 - 2022
- Figure 3-8 | Sailboat Market, 2007 - 2017
- Table | Sailboat Demand by Design, 2007 - 2022
- Table | Sailboat Demand by Length, 2007 - 2022
- Table | Selected Sailboat Producers
- Other Recreational Boats
- Table | Other Recreational Boats Supply & Demand, 2007 - 2022
- Figure 3-9 | Other Recreational Boats Market, 2007 - 2017
- Key Findings
- PROPULSION SYSTEMS & BOATING ACCESSORIES
- Key Findings
- Figure 4-1 | Key Trends in Propulsion Systems & Boating Accessories
- Overview
- Table | Propulsion Systems and Boating Accessories Overview
- Propulsion Systems
- Regulatory & Overview
- Supply & Demand Forecast
- Table | Propulsion System Supply & Demand, 2007 - 2022
- OEM Propulsion Systems
- Table | OEM Propulsion System Demand, 2007 - 2022
- Figure 4-2 | Evinrude's E-TEC G2 200-Horsepower Outboard Engine
- Table | OEM Outboard Propulsion System Demand, 2007 - 2022
- Table | Selected Outboard Propulsion System Producers
- Table | OEM Inboard & Sterndrive Propulsion System Demand, 2007 - 2022
- Table | Selected Inboard & Sterndrive Propulsion System Producers
- Repower Propulsion Systems
- Table | Repower Propulsion System Demand, 2007 - 2022
- Boating Accessories
- Overview
- Supply & Demand Forecast
- Table | Boating Accessory Supply & Demand, 2007 - 2022
- Figure 4-3 | Boating Accessories Market, 2007 - 2017
- Navigational & Electric
- Figure 4-4 | Lowrance's Hook2 12 TripleShot Transducer
- Trailers
- Other Accessories
- Key Findings
- REGIONS
- Key Findings
- Figure 5-1 | Key Regional Trends in Recreational Boating
- Regional Trends
- Overview
- Economic
- Table | US Personal Consumption Expenditures by Region, 2007 - 2022
- Population
- Table | Population by Region, 2007 - 2022
- Boat Ownership
- Table | Share of Consumers Whose Household Owns a Boat by Region, 2017
- Demand by Region
- Table | Recreational Boating Demand by Region, 2007 - 2022
- Figure 5-2 | Recreational Boating Demand by Region, 2017
- Northeast
- Northeast: Overview
- Figure 5-3 | Northeast Recreational Boating Market Position
- Table | Northeast Recreational Boating Demand by Subregion & Product, 2007 - 2022
- New England
- Middle Atlantic
- Northeast: Overview
- Midwest
- Midwest: Overview
- Figure 5-4 | Midwest Recreational Boating Market Position
- Table | Midwest Recreational Boating Demand by Subregion & Product, 2007 - 2022
- East North Central
- West North Central
- Midwest: Overview
- South
- South: Overview
- Figure 5-5 | South Recreational Boating Market Position
- Table | South Recreational Boating Demand by Subregion & Product, 2007 - 2022
- South Atlantic
- East South Central
- West South Central
- South: Overview
- West
- West: Overview
- Figure 5-6 | West Recreational Boating Market Position
- Table | West Recreational Boating Demand by Subregion & Product, 2007 - 2022
- Mountain
- Pacific
- West: Overview
- Key Findings
- INDUSTRY STRUCTURE
- Key Findings & Industry Composition
- Table | US Recreational Boating Product Sales by Company, 2017
- Market Share
- Overview
- Figure 6-1 | US Recreational Boating Market Share, 2017
- Brunswick
- Figure 6-2 | Recreational Boating: Leading Supplier
- Yamaha Motor
- Figure 6-3 | Recreational Boating: Second Leading Supplier
- Second Tier Suppliers
- Other Leading Suppliers
- Overview
- Competitive Strategies
- Table | Competitive Strategies in the US Recreational Boating Industry
- Product Development
- Manufacturing
- Distribution
- Marketing
- Mergers & Acquisitions
- Table | Selected Acquisitions & Divestitures
- Cooperative Agreements
- Table | Selected Cooperative Agreements
- List of Industry Participants
- Key Findings & Industry Composition
- APPENDIX
- Scope
- Table | Study Scope: US Geographic Regions & Subregions
- Table | Relevant Industry Codes
- Methodology
- Sources
- Associations & Agencies
- Related Freedonia Group Studies
- US Studies
- Global Studies
- Definitions
- General
- Recreational Boats
- Propulsion Systems & Boating Accessories
- Abbreviations
- Table | Abbreviations & Acronyms Used in Study
- Macroeconomic Assumptions
- Economic Environment
- Table | Macroeconomic Indicators, 2007 - 2022
- Figure 7-1 | Annual Growth in Real GDP, 2000 - 2017, Compared to 1980 - 2005 Average
- Demographics
- Table | Population & Households, 2007 - 2022
- Figure 7-2 | Annual Population Growth, 2002 - 2017
- Consumer Spending
- Table | Personal Consumption Expenditures, 2007 - 2022
- Consumer Financing
- Table | Consumer Financing Environment, 2007 - 2017
- Economic Environment
- Scope