Recreational Vehicles in the US by Product, 6th Edition
Since 2016, at least three dozen RV manufacturing locations have added or announced expanded plant capacity.

Free Sample Report
Request a free sample of this report and our team will email it to you.
Report Overview
Featuring 44 tables and 47 figures – now available in Excel and Powerpoint! Learn More
Manufacturing Expansions Show Strong Outlook
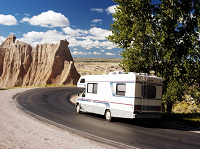
Since 2016, at least three dozen RV manufacturing locations have added or announced expanded plant capacity. While the top two manufacturers in the RV industry, Forest River (4 projects) and Thor (13 projects), account for the most activity, smaller companies, like nüCamp and RV Factory, have also made additions to their manufacturing square footage. While the expansions are intended to support production for a variety of products, the majority are aimed at travel trailer manufacturing. The construction projects are an indication of confidence in the extended outlook of the market.
Key Findings in the Recreational Vehicles in the US Study:
A Healthy Economy Has Spurred Consumer Confidence and Expenditures
Since the Great Recession, during which demand for recreational vehicles fell sharply, the economy has been slowly improving, along with consumer spending. Interest rates remain low, keeping loans for large purchases relatively affordable. Moreover, home values continue to rise, giving consumers access to equity to support loans for RVs.
Travel Trailers Have Led the RV Industry Recovery and Will Continue to Do So Going Forward
Sales of travel trailers continue to grow, even surpassing pre-recession peaks. In 2017, unit sales of travel trailers were nearly 200% of 2007 levels. Travel trailers are favored for their variety of options, from luxury to low-cost entry-level versions, and from those that require a large truck to pull them to those that can be managed by most small automobiles. In general, trailers are preferred because, unlike motorhomes, they can be left behind at a campsite while the owner tours the area in a conventional automobile that can be parked anywhere. Current models appeal to a range of consumers – from those looking for a retro or European look or a functional vehicle that can haul their ATV or snowmobile, to long-term travelers and to those on a quick weekend getaway.
More Reasons to Own an RV and More Demographics to Own Them
The typical RV owner still falls in an older demographic – retirees and “snow birds” – but younger consumers are particularly motivated by lifestyle reasons including:
- taking just the basics to escape the bustle of daily life
- traveling with all of the comforts of home, including pets, while connected via Wi-Fi and electronic devices
- living the “weekend warrior” lifestyle, tailgating at sporting events or concerts, camping, or taking motorcycles or other gear out for recreation
- living and working full-time or for extended stretches on the road
Study Coverage
This study presents historical data (2007, 2012, and 2017) and forecasts for 2022 by product (conventional travel trailers, fifth-wheel travel trailers, class A motorhomes, class B motorhomes, class C motorhomes, folding camping trailers, truck campers) in units and US dollars, and by region (Northeast, Midwest, South, West) in US dollars. The study covers accessories for RVs sold in the aftermarket. In addition, it evaluates key industry players in the RV market and analyzes consumer survey data.
This study analyzes US demand for recreational vehicles by product and region. Additionally, the study analyzes aftermarket accessories for recreational vehicles.
The US RV industry is broken out into the following product segments:
- travel trailers
- motorhomes
- campers and camping trailers
Travel trailers include conventional and fifth-wheel types. Motorhomes include class A, class B, and class C motorhomes. Campers and camping trailers include folding camping trailers and truck campers. These vehicles are designed to provide temporary living quarters for a variety of recreational, travel, camping, or other seasonal applications.
Aftermarket accessories for recreational vehicles, which include navigational and electronic systems as well as other components, are discussed separately.
Conversion vans, personal off-road vehicles (such as ATVs, snowmobiles, and dirt bikes) and manufactured housing for long-term residence (including park trailers and mobile homes) are not included in the scope of this study.
Demand for recreational vehicles is also segmented by the following US geographic regions and subregions:
- Northeast (New England, Middle Atlantic)
- Midwest (East North Central, West North Central)
- South (South Atlantic, East South Central, West South Central)
- West (Mountain, Pacific)
Historical data for 2007, 2012, and 2017 and forecasts for 2022 are provided in current dollars (which are not adjusted to account for inflation) for demand, manufacturers’ shipments, and imports and exports for aggregate recreational vehicle products. Demand and current dollar shipment information is also given for each product classification at the manufacturers’ level (unless otherwise specified) and, for many key product categories, demand is also provided in unit terms.
Data provided for accessories reflects only those items that are sold separately to the consumer in the aftermarket. Factory-installed accessories or those included in a recreational vehicle package are considered with the RV.
- EXECUTIVE SUMMARY
- Figure 1-1 | Key Trends in the US Recreational Vehicle Market
- OVERVIEW
- Key Findings
- Figure 2-1 | Key Trends in Recreational Vehicles
- Recreational Vehicle Supply & Demand
- Historical Trends
- Figure 2-2 | Recreational Vehicle Market, 2007 – 2022
- Supply & Demand Forecast
- Table | Recreational Vehicle Supply & Demand, 2007 – 2022
- Historical Trends
- RV Owner Demographic Profile
- Figure 2-3 | Demographic Profile of Consumers Who Traveled by Motorhome/RV for Any Trip in Last 12 M
- Travel Preferences of RV Owners
- Overview
- RVs Offer Better Value & Convenience
- Figure 2-4 | Consumer Attitudes About the Value of RV Travel Versus Staying in a Hotel
- Figure 2-5 | Consumer Attitudes About the Convenience of RV Travel Versus Staying in a Hotel
- RVs Offer Better Opportunities to Meet People
- Figure 2-6 | Consumer Attitudes About the Social Value of RV Travel
- Road Travel Is More Enjoyable
- Figure 2-7 | Consumer Attitudes About Traveling on the Road Versus by Airplane or Train
- Outdoor Lifestyle Trends
- Table | Activities of Consumers Who Traveled by Motorhome/RV for Any Trip in Last 12 Months
- Tiny House Movement Spreads to RVs
- Overview & Preferences
- Figure 2-8 | Consumer Attitudes About Living in a Tiny Home
- Demand Opportunity
- Figure 2-9 | Destination Trailers
- Overview & Preferences
- Recreational Vehicle Retail Environment
- Table | Recreational Vehicle Retail Sales
- Recreational Vehicle Stock
- Table | Recreational Vehicles in Use
- Recreational Vehicle Ownership Costs
- RV Rental Market
- Pricing
- Table | Recreational Vehicle Prices, 2007 – 2022
- Figure 2-10 | Historical Recreational Vehicle Pricing, 2007 – 2017
- Motorhomes by Engine Type
- Table | Motorhome Demand by Engine Type, 2007 – 2022
- Figure 2-11 | Motorhome Demand by Engine Type, 2007 – 2022
- Product Highlights
- Overview
- Outdoor Kitchens
- Figure 2-12 | Outdoor Kitchens
- RUVs
- Figure 2-13 | RUV Motorhomes
- Slide-Outs & Other Space Expansions
- Figure 2-14 | Space Expansions to Conventional Trailers
- Toy Haulers
- Figure 2-15 | Toy Haulers
- Regulatory & Safety Issues
- Licensing & Taxation
- Safety Standards
- Table | RV Features & Their Regulatory Standards
- Global Outlook
- North America
- Western Europe
- Asia/Pacific
- Trade
- Table | Recreational Vehicle Foreign Trade
- Key Findings
- PRODUCTS
- Key Findings
- Figure 3-1 | Key Trends in Recreational Vehicle Products
- RV Supply & Demand
- Overview
- Table | Recreational Vehicle Types Overview
- Manufacturing Expansions
- Table | Selected Recreational Vehicle Manufacturing Expansions
- Recreational Vehicle Supply & Demand Forecast
- Table | Recreational Vehicle Supply & Demand, 2007 – 2022
- Figure 3-2 | Demand for Recreational Vehicles: Volume & Value, 2017
- Travel Trailers
- Figure 3-3 | Highlights of Travel Trailer Types
- Table | Travel Trailer Supply & Demand, 2007 – 2022
- Figure 3-4 | Conventional Travel Trailers
- Table | Conventional Travel Trailer Demand, 2007 – 2022
- Figure 3-5 | Conventional Travel Trailer Demand by Length, 2007 – 2022
- Figure 3-6 | Fifth-Wheel Travel Trailers
- Table | Fifth-Wheel Trailer Demand, 2007 – 2022
- Table | Selected Travel Trailer Manufacturers & Products
- Figure 3-7 | Travel Trailer Market Share, 2017
- Motorhomes
- Table | Motorhome Supply & Demand, 2007 – 2022
- Figure 3-8 | Motorhome Demand by Type, 2007 – 2017
- Figure 3-9 | Class A Motorhomes
- Table | Class A Motorhome Demand, 2007 – 2022
- Figure 3-10 | Class B Motorhomes
- Table | Class B Motorhome Demand, 2007 – 2022
- Figure 3-11 | Class C Motorhomes
- Table | Class C Motorhome Demand, 2007 – 2022
- Table | Selected Motorhome Manufacturers & Products
- Figure 3-12 | Motorhome Market Share, 2017
- Campers & Camping Trailers
- Table | Camper & Camping Trailer Supply & Demand, 2007 – 2022
- Figure 3-13 | Camper & Camping Trailer Demand, 2007 – 2017
- Figure 3-14 | Folding Camping Trailers
- Table | Folding Camper Trailer Demand, 2007 – 2022
- Figure 3-15 | Truck Campers
- Table | Truck Camper Demand, 2007 – 2022
- Table | Selected Camper & Camping Trailer Manufacturers & Products
- Overview
- Aftermarket Accessories Demand
- Overview
- Demand Outlook
- Table | Recreational Vehicle Accessories Demand, 2007 – 2022
- Figure 3-16 | Accessories Demand Versus RV Demand, 2007 – 2017
- Figure 3-17 | Rand McNally's OverDryve 7 RV GPS Tablet
- Key Findings
- REGIONS
- Key Findings
- Figure 4-1 | Key Regional Trends in Recreational Vehicles
- Regional Trends
- Overview
- Economic Environment
- Table | US Personal Consumption Expenditures by Region, 2007 – 2022
- Population
- Table | Population by Region, 2007 – 2022
- RV Travel Trends
- Table | Regional Share of Consumers Who Traveled by RV or Motorhome for Any Trip in the Past 12 Months, 2017
- Demand by Region
- Table | Recreational Vehicle Demand by Region, 2007 – 2022
- Figure 4-2 | Recreational Vehicle Demand by Region, 2017
- Northeast
- Northeast: Overview
- Figure 4-3 | Northeast Recreational Vehicle Market Position
- Table | Northeast Recreational Vehicle Demand by Subregion, 2007 – 2022
- New England
- Middle Atlantic
- Northeast: Overview
- Midwest
- Midwest: Overview
- Figure 4-4 | Midwest Recreational Vehicle Market Position
- Table | Midwest Recreational Vehicle Demand by Subregion, 2007 – 2022
- East North Central
- West North Central
- Midwest: Overview
- South
- South: Overview
- Figure 4-5 | South Recreational Vehicle Market Position
- Table | South Recreational Vehicle Demand by Subregion, 2007 – 2022
- South Atlantic
- East South Central
- West South Central
- South: Overview
- West
- West: Overview
- Figure 4-6 | West Recreational Vehicle Market Position
- Table | West Recreational Vehicle Demand by Subregion, 2007 – 2022
- Mountain
- Pacific
- West: Overview
- Key Findings
- INDUSTRY STRUCTURE
- Key Findings & Industry Composition
- Table | US Recreational Vehicles Product Sales by Company, 2017
- Market Share
- Figure 5-1 | US Recreational Vehicles Market Share, 2017
- Figure 5-2 | Recreational Vehicles: Leading Supplier
- Figure 5-3 | Recreational Vehicles: Second Leading Supplier
- Figure 5-4 | Recreational Vehicles: Third Leading Supplier
- Figure 5-5 | Recreational Vehicles: Fourth Leading Supplier
- Figure 5-6 | Recreational Vehicles: Fifth Leading Supplier
- Competitive Strategies
- Table | Competitive Strategies in the US Recreational Vehicles Industry
- Manufacturing
- Marketing
- Brand Awareness & Loyalty Marketing
- Lifestyle Marketing
- Channels of Distribution
- Mergers & Acquisitions
- Table | Selected Acquisitions & Divestitures
- Cooperative Agreements
- List of Industry Participants
- Key Findings & Industry Composition
- APPENDIX
- Scope
- Table | Study Scope: US Geographic Regions & Subregions
- Table | Relevant Industry Codes
- Methodology
- Sources
- Associations & Agencies
- Related Freedonia Group Studies
- Definitions
- Abbreviations
- Table | Abbreviations & Acronyms Used in Study
- Macroeconomic Assumptions
- Economic Environment
- Table | Macroeconomic Indicators, 2007 – 2022
- Figure 6-1 | Annual Growth in Real GDP, 2000 – 2017, Compared to 1980 – 2005 Average
- Demographic Trends
- Table | Population & Households, 2007 – 2022
- Figure 6-2 | Annual Population Growth, 2002 – 2017
- Consumer Spending
- Table | Personal Consumption Expenditures, 2007 – 2022
- Recreational Expenditures
- Table | Recreational Expenditures, 2007 – 2022
- Consumer Financing
- Table | Consumer Financing Environment, 2007 – 2017
- Economic Environment
- Scope