Report Overview
Featuring 59 tables and 20 figures – available in Excel and Powerpoint! Learn More
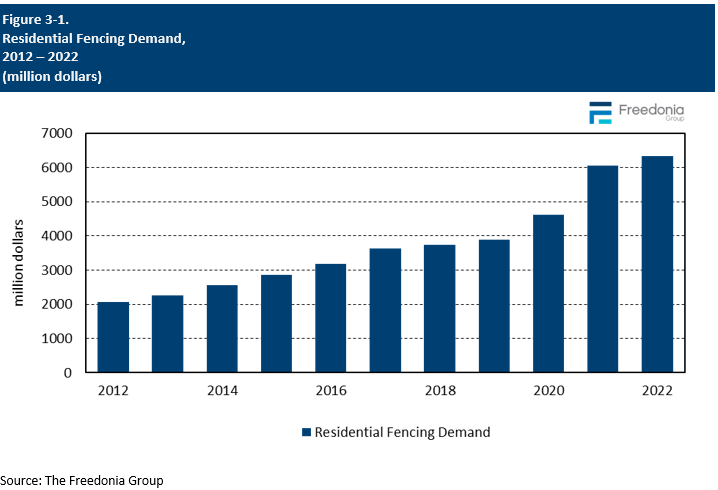
This Freedonia industry study analyzes the over $6 billion US residential market for fencing. It presents historical demand data (2012, 2017, and 2022) and  forecasts (2027 and 2032) as well as annual data for years 2019-2026. Unit demand and value demand data is shown for Fencing by material (metal, wood, plastic, composite, concrete), product type (chain link fencing, wire fencing, ornamental fencing, privacy fencing, post & rail fencing, split rail fencing, brick fencing, stone fencing) and market (new, improvement, and repair demand in residential applications). The study also evaluates company market share and competitive analysis on industry competitors.
US residential fencing demand is forecast to grow 1.0% annually to $6.7 billion in 2027. Market value will be hindered by a moderation in material prices from a high 2022 base and relatively weak growth in linear feet terms as new housing construction declines. However, some growth will occur as higher value fencing materials, such as metal ornamental fencing, are increasingly installed on homeowners’ properties.
Aesthetics & Durability Drive Demand for Metal Ornamental Fencing
Metal ornamental fencing has become increasingly popular due to its more aesthetically pleasing designs and durability. Sales will continue to rise through 2027, with metal ornamental fencing boasting the fastest growth of any major product. Continued expansion will be supported by:
-
homeowners opting for metal ornamental fencing over other products due to its ability to enhance the aesthetics and boost the value of properties on which it is installed
-
apartment complex owners wanting more attractive fencing to demarcate the boundaries for their properties
-
rising installations of in-ground pools, as metal fencing can be required by insurance policies
Plastic & Composite Fencing Will Continue to Take Share From Wood
Sales of plastic and composite fencing have benefited from the increased interest in alternatives to traditional wood fencing that offer greater durability and less maintenance. Going forward, plastic fencing (primarily vinyl) will continue to increase its share of residential fencing demand due to:
-
development of vinyl fencing that better resembles wood, thereby increasing its appeal in residential applications
-
a greater number of plastic fencing manufacturers entering the market, placing downward pressure on prices and making products more affordable
Although it will continue to account for a small share of demand, composite fencing will see increased use in the residential market due to:
-
its sustainability, as composite fencing does not rely on virgin wood, can incorporate recycled materials into its production, and is perceived as being more environmentally friendly than plastic fencing
-
more consumer awareness of better performing composite products, including capstock-coated composite lumber, which resists decay and mold growth
- the greater availability of these products from a wider variety of sources, as more composite decking companies enter the fencing market due to the ease with which they can tailor their decking production processes to make composite fencing
Historical Market Trends
Demand shifts in residential fencing can vary considerably by year; such fluctuations are primarily related to trends in construction spending and new home purchasing activity. Specific factors impacting annual fencing demand include:
-
the size and age of the US housing stock
-
trends in average property size
-
levels of housing starts, particularly in the single-family housing segment, and existing home sales
-
levels of home renovation activity
-
interest rates – low interest rates may encourage homeowners to take out lines of credit to fund new fence installations or repairs
In addition, other variables can affect demand for fencing in a particular year or over a period of time. These include:
-
weather conditions, especially outbreaks of severe weather that cause widespread damage to fences (hurricanes and tropical storms, tornadoes, winter storms, and so on)
-
changes and modifications to state and local building codes
-
changes in the prices of raw materials (e.g., metal, plastic, lumber) that can raise or lower the per-square cost of fencing materials
-
consumer preferences for stay-at-home activities such as gardening, swimming, or outside entertaining, which may require fencing for security or privacy
Residential fencing demand rose sharply in 2020, a marked contrast to the weaker demand growth of 2018 and 2019. This growth was spurred primarily by changes in consumer work and home activity attributable to the pandemic; housing starts surged as consumers (especially those in densely packed urban areas) sought newly built homes in suburban and exurban areas.
Homeowners had greater disposable income due to government stimulus payments and reduced out-of-home spending, so they opted to engage in large-scale home improvement projects like the installation of new fencing.
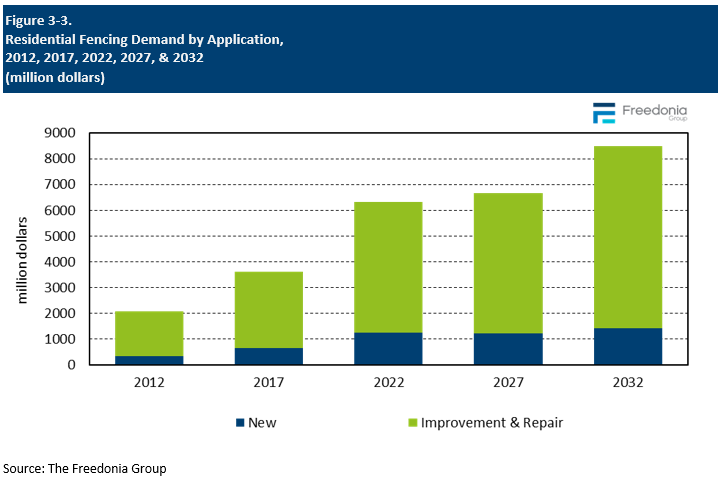
Applications
Demand by Application
The residential fencing market is comprised of two segments:
-
New, which includes fencing installed around new homes (either during their construction or soon thereafter).
-
Improvement and repair, which includes both new fences installed around existing homes and repair work on existing fences.
The improvement and repair segment accounted for 81% of residential fencing demand in 2022, and it will see gains through 2027 as the repair and replacement of old fences remains popular. The new segment will see a sharp decline in demand in 2023 as new housing construction falls.
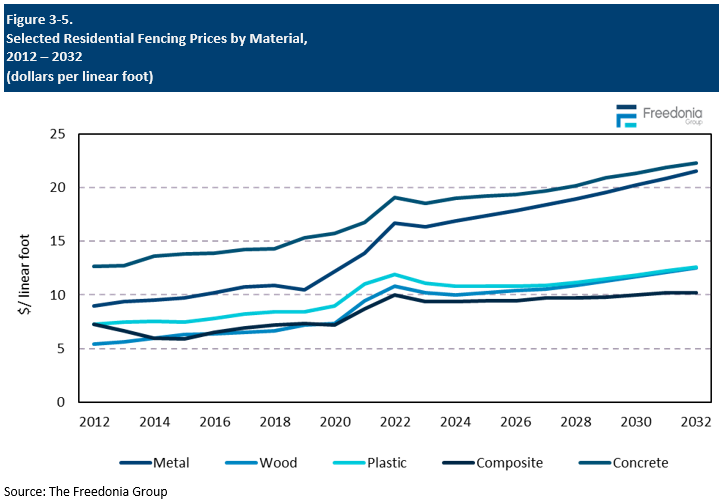
Pricing Trends
Price changes for fencing products are generally driven by fluctuations in the underlying cost of raw materials such as lumber, plastic resin, and metal. The average price of fencing also depends on trends in the product mix, with faster growth in higher priced fencing options generally driving up average prices over the recent historical period.
Through 2027, the average price per linear foot of fencing is forecast to stay nearly flat at $13, with most product categories staying in line with the industry average:
-
Growth in average metal fencing prices will be supported by increasing demand for high-value ornamental metal fencing.
-
Wood fencing price decreases will be supported by stabilizing lumber prices and easing of supply chain issues.
- The average cost of plastic and composite fencing will decrease as more manufacturers enter the market and have downward pressure on prices.
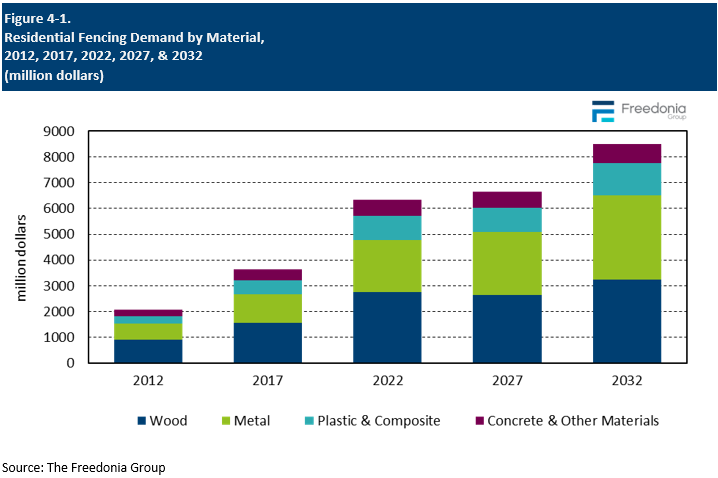
Demand by Material
Wood accounts for the largest share of fencing demand in the residential market in terms of both value and volume, followed by metal:
-
Wood fencing is popular for residential applications because it is generally inexpensive and enhances property values.
-
Metal fencing is also commonly used in residential applications. Ornamental metal and chain link fencing are popular because of their durability, which makes them well suited for home security.
-
Demand for plastic fencing has grown due to its ease of maintenance and long life span. The fencing can come in a variety of colors, including those that have the appearance of wood, making it more aesthetically pleasing in residential applications.
-
Composite fencing has historically seen more limited use in residential markets, but it is increasingly favored by consumers who value the low maintenance and durability relative to wood, despite the higher price tags.
- Demand for concrete and other fencing materials is also restricted in this market. However, concrete is sometimes specified for its durability, and precast concrete products see use in privacy fences for housing developments and individual properties.