US Bottled Water Packaging
This Freedonia industry study analyzes the $13.9 billion bottled water packaging industry. It presents historical demand data (2012, 2017, and 2022) and forecasts (2027) by product (containers, multipack packaging, closures and labels), material (metal, glass, plastic, paperboard, molded fiber), and application (still water, sparkling water).
Free Sample Report
Request a free sample of this report and our team will email it to you.
Report Overview
 Plastic Dominance Continues Despite Eco Shift - See Why
This Freedonia industry study analyzes the $13.9 billion bottled water packaging industry. It presents historical demand data (2012, 2017, and 2022) and forecasts (2027) by product (containers, multipack packaging, closures and labels), material (metal, glass, plastic, paperboard, molded fiber), and application (still water, sparkling water). Annual historical data and forecasts are also provided from 2019 to 2026. Data are given in unit and dollar value.
Featuring 54 tables and 24 figures – available in Excel and Powerpoint! Learn More
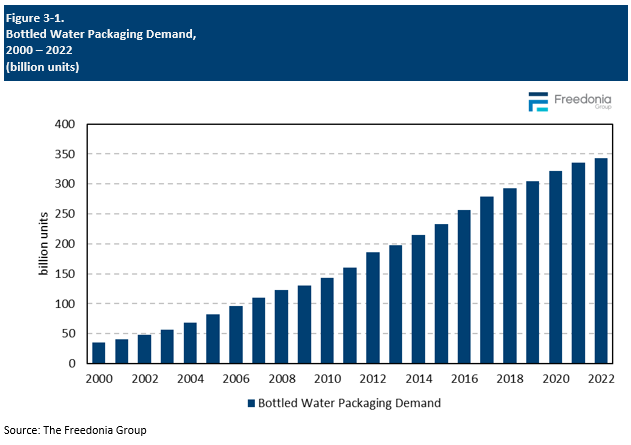
Demand for bottled water packaging is forecast to increase 2.9% annually to $16.0 billion in 2027, with unit demand expected to grow 1.8% annually to 375 billion. Gains will be supported by above average growth in the sparkling water market and, despite its maturity, significant continuing sales of bottled still water. Market value will be boosted by the above average growth of containers made with higher-priced alternative materials.
Plastic to Maintain Dominance Despite Sustainability Concerns
Plastic will continue to dominate the US bottled water packaging market due to its low cost, good performance and versatility. As the environmental impact of plastic packaging remains a concern, packaging suppliers are looking for ways to incorporate more sustainable practices into their production model. This includes increasing their use of recycled plastics (particularly recycled PET) in order to reduce reliance on virgin plastics and appeal to environmentally conscious consumers.
Sustainability Drives Growth for Aluminum Bottles, Molded Fiber & Paperboard Containers
Demand for aluminum bottles and paperboard and molded fiber containers will experience rapid growth from a small base. Notable for their environmental benefits, these sustainable materials cater to growing consumer demand for environmentally conscious alternatives to traditional plastic packaging:
-
Aluminum bottles’ durability, high recyclability, and energy-efficient production methods make them more appealing than plastic bottles.
-
Molded fiber bottles and paperboard bottles and cartons are biodegradable and made from renewable resources, aligning with the environmental values of health-conscious consumers.
These products represent higher value alternatives to plastic bottles, and will therefore contribute to market value gains. However, cost and customer acceptance will remain key hurdles to overcome to achieve significant market penetration.
Sparkling Water Packaging Demand Will Log Faster Growth Than Still Water
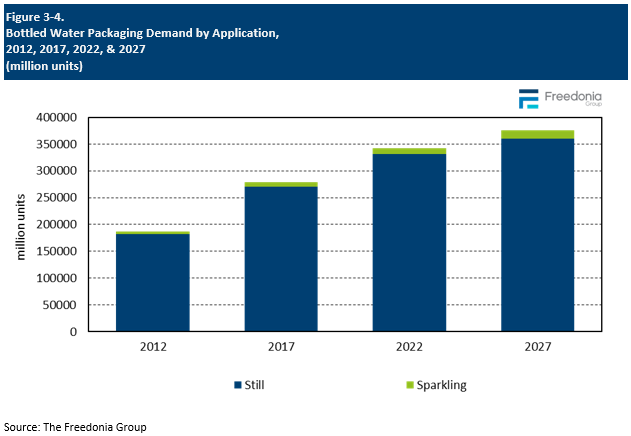
While both still and sparkling water packaging will register good growth, still water will maintain its larger market share while the sparkling water segment will grow at a much faster rate through 2027. This is due to consumer shifts away from sugary soft drinks toward healthier carbonated alternatives. Aluminum cans will remain the primary container for sparkling water due to their excellent oxygen barrier properties, which maintain product freshness, although plastic bottles are key for larger sized packages.
Historical Market Trends
The US bottled water packaging industry is heavily dependent upon general trends in consumption and production of the beverage itself. Prospects for the bottled water industry are impacted by a range of variables, many of which are beyond the control of industry participants. These include:
-
macroeconomic shifts, as in levels of consumer spending and disposable income or overall economic growth and inflation
-
demographic factors like the size of the resident population, age distribution patterns, ethnic diversity, geographic distribution, and immigration
The industry is also influenced by less predictable factors – weather patterns, raw material prices, technological innovations, medical and health related research, governmental regulations, foreign trade, and changes in consumer preferences and tastes – that are beyond the control of bottled water manufacturers. What those companies can control are things like advertising, marketing, and new product introductions, which all typically have a greater impact on the product mix than total bottled water demand; they can also impact the level and type of packaging used.
Bottled water packaging demand is also influenced by overall trends in the packaging industry. Among those factors are environmental and regulatory issues, such as sustainability initiatives, that can spur demand for packaging that is perceived to be environmentally friendly. Other key considerations that affect consumer preferences for bottled water packaging include convenience, size (e.g., single-serving, multipacks), image, and technological developments (e.g., smart packaging, materials innovations).
Applications (Still Water, Sparkling Water)
Demand for bottled water packaging is forecast to increase 2.9% per year to $16.0 billion in 2027, with real growth of 1.8% annually to 375.3 billion units. These increases will largely be aided by the large sales for still water, despite its maturity, and strong growth of sparkling water,which is positioned as a healthy alternative to soda and other soft drinks.
Still water has historically been packaged in PET or glass bottles. However, alternatives such as aseptic cartons; gable top cartons; and bottles made from metal, paperboard, and molded fiber are increasingly penetrating the market. They offer improved product differentiation capabilities and can potentially impart (or enhance) a perception of sustainability.
Though plastic and glass bottles also comprise a large portion of packaging demand for sparkling water, cans are the most common format due to their position as a competitor to sodas and other soft drinks often packaged in cans.
The growing popularity of unsweetened enhanced water will support growth of bottles and other containers which can be resealed, as these drinks are often used when working out or on-the-go, somewhat limiting their amenability to be packaged in cans, as well as glass bottles due to their higher weight and breakability.
Bottled Water Production Outlook
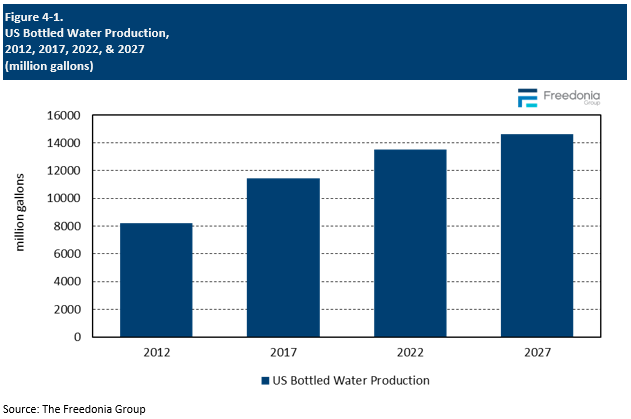
US packaged bottled water production is expected to advance 1.9% per year to 12.6 billion gallons in 2027. Consumption of bottled water continues to grow, aided by a greater awareness of the negative health effects – e.g., obesity, diabetes – associated with other beverages with high sugar content, like carbonated soft drinks and juice drinks. Sparkling water will experience especially strong growth because it is increasingly marketed as a healthy alternative to CSDs. However, faster advances will be restrained by competition from beverages such as ready-to-drink (RTD) coffee and tea and energy drinks, as well as the increasing use of tap water filtration devices (due to the poor environmental image of packaged water).
Gains in the bottled water market will continue to be supported by the widespread perception that it is superior in taste and quality to tap water. However, bottled water – particularly when packaged in PET bottles – still suffers from an image of poor sustainability compared to tap water. To combat this image, manufacturers of bottled water packaging are increasingly incorporating recycled content into their plastic bottles, as well as exploring alternative material options such as metal cans, metal bottles, gable top cartons, and paper and molded fiber bottles, which may offer a superior environmental image. The higher cost of these products compared to similarly sized PET bottles will also support value gains of bottled water packaging.
Bottled water prospects will further be restrained to some extent by competition from lightly sweetened seltzers (which are considered soft drinks), other beverages seen as healthy (such as natural sodas, sparkling juices, and RTD tea), home water purification systems, and home delivery of bulk water. For households that regularly consume large volumes of bottled water, often in lieu of tap water, home water purification systems and bulk water deliveries offer the advantages of lower cost and improved convenience compared to bottled water purchased at retail sites.
Foodservice Industry Outlook
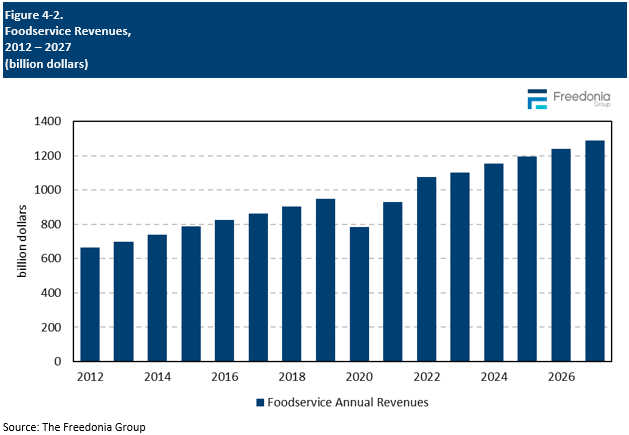
Foodservice revenues are forecast to grow 3.7% per year to $1.3 trillion in 2027, supported by continued real recovery in the foodservice industry and trends toward eating away from home. However, advances in market value will be limited to some extent as pricing normalizes from the inflated levels of 2022.
Until 2020, growth in foodservice outlets had outpaced sales growth in beverages consumed at home. The steady increase in the share of beverage consumption held by foodservice outlets up until 2020 was the result of several factors, including:
-
generally higher incomes
-
busy lifestyles
-
increased foodservice options
-
growing availability of curbside pickup and delivery
Foodservice operators generally purchase beverages such as bottled water from major wholesale distributors which form a midpoint along the supply chain as they sell beverages to restaurants, hospitality and healthcare facilities, and other foodservice venues.
The rise of delivery options from third-party service providers (e.g., Uber Eats, DoorDash) and the convenience of ordering both carryout and delivery via an app will continue to be key to foodservice industry growth – most notably for full-service restaurants. These services broaden the potential market of customers beyond those who are able and willing to visit restaurant establishments. However, this will not benefit foodservice bottled water consumption as much as it will food consumption, as beverages are less likely to be purchased with carryout or delivery orders compared to on-premises orders.
Demand for bottled water packaging is forecast to increase 2.9% annually to $16.0 billion in 2027, with unit demand expected to grow 1.8% annually to 375 billion. Gains will be supported by above average growth in the sparkling water market and, despite its maturity, significant continuing sales of bottled still water. Market value will be boosted by the above average growth of containers made with higher-priced alternative materials.
Plastic to Maintain Dominance Despite Sustainability Concerns
Plastic will continue to dominate the US bottled water packaging market due to its low cost, good performance and versatility. As the environmental impact of plastic packaging remains a concern, packaging suppliers are looking for ways to incorporate more sustainable practices into their production model. This includes increasing their use of recycled plastics (particularly recycled PET) in order to reduce reliance on virgin plastics and appeal to environmentally conscious consumers.
Sustainability Drives Growth for Aluminum Bottles, Molded Fiber & Paperboard Containers
Demand for aluminum bottles and paperboard and molded fiber containers will experience rapid growth from a small base. Notable for their environmental benefits, these sustainable materials cater to growing consumer demand for environmentally conscious alternatives to traditional plastic packaging:
-
Aluminum bottles’ durability, high recyclability, and energy-efficient production methods make them more appealing than plastic bottles.
-
Molded fiber bottles and paperboard bottles and cartons are biodegradable and made from renewable resources, aligning with the environmental values of health-conscious consumers.
These products represent higher value alternatives to plastic bottles, and will therefore contribute to market value gains. However, cost and customer acceptance will remain key hurdles to overcome to achieve significant market penetration.
Sparkling Water Packaging Demand Will Log Faster Growth Than Still Water
While both still and sparkling water packaging will register good growth, still water will maintain its larger market share while the sparkling water segment will grow at a much faster rate through 2027. This is due to consumer shifts away from sugary soft drinks toward healthier carbonated alternatives. Aluminum cans will remain the primary container for sparkling water due to their excellent oxygen barrier properties, which maintain product freshness, although plastic bottles are key for larger sized packages.
Historical Market Trends
The US bottled water packaging industry is heavily dependent upon general trends in consumption and production of the beverage itself. Prospects for the bottled water industry are impacted by a range of variables, many of which are beyond the control of industry participants. These include:
-
macroeconomic shifts, as in levels of consumer spending and disposable income or overall economic growth and inflation
-
demographic factors like the size of the resident population, age distribution patterns, ethnic diversity, geographic distribution, and immigration
The industry is also influenced by less predictable factors – weather patterns, raw material prices, technological innovations, medical and health related research, governmental regulations, foreign trade, and changes in consumer preferences and tastes – that are beyond the control of bottled water manufacturers. What those companies can control are things like advertising, marketing, and new product introductions, which all typically have a greater impact on the product mix than total bottled water demand; they can also impact the level and type of packaging used.
Bottled water packaging demand is also influenced by overall trends in the packaging industry. Among those factors are environmental and regulatory issues, such as sustainability initiatives, that can spur demand for packaging that is perceived to be environmentally friendly. Other key considerations that affect consumer preferences for bottled water packaging include convenience, size (e.g., single-serving, multipacks), image, and technological developments (e.g., smart packaging, materials innovations).

Applications (Still Water, Sparkling Water)
Demand for bottled water packaging is forecast to increase 2.9% per year to $16.0 billion in 2027, with real growth of 1.8% annually to 375.3 billion units. These increases will largely be aided by the large sales for still water, despite its maturity, and strong growth of sparkling water,which is positioned as a healthy alternative to soda and other soft drinks.
Still water has historically been packaged in PET or glass bottles. However, alternatives such as aseptic cartons; gable top cartons; and bottles made from metal, paperboard, and molded fiber are increasingly penetrating the market. They offer improved product differentiation capabilities and can potentially impart (or enhance) a perception of sustainability.
Though plastic and glass bottles also comprise a large portion of packaging demand for sparkling water, cans are the most common format due to their position as a competitor to sodas and other soft drinks often packaged in cans.
The growing popularity of unsweetened enhanced water will support growth of bottles and other containers which can be resealed, as these drinks are often used when working out or on-the-go, somewhat limiting their amenability to be packaged in cans, as well as glass bottles due to their higher weight and breakability.

Bottled Water Production Outlook
US packaged bottled water production is expected to advance 1.9% per year to 12.6 billion gallons in 2027. Consumption of bottled water continues to grow, aided by a greater awareness of the negative health effects – e.g., obesity, diabetes – associated with other beverages with high sugar content, like carbonated soft drinks and juice drinks. Sparkling water will experience especially strong growth because it is increasingly marketed as a healthy alternative to CSDs. However, faster advances will be restrained by competition from beverages such as ready-to-drink (RTD) coffee and tea and energy drinks, as well as the increasing use of tap water filtration devices (due to the poor environmental image of packaged water).
Gains in the bottled water market will continue to be supported by the widespread perception that it is superior in taste and quality to tap water. However, bottled water – particularly when packaged in PET bottles – still suffers from an image of poor sustainability compared to tap water. To combat this image, manufacturers of bottled water packaging are increasingly incorporating recycled content into their plastic bottles, as well as exploring alternative material options such as metal cans, metal bottles, gable top cartons, and paper and molded fiber bottles, which may offer a superior environmental image. The higher cost of these products compared to similarly sized PET bottles will also support value gains of bottled water packaging.
Bottled water prospects will further be restrained to some extent by competition from lightly sweetened seltzers (which are considered soft drinks), other beverages seen as healthy (such as natural sodas, sparkling juices, and RTD tea), home water purification systems, and home delivery of bulk water. For households that regularly consume large volumes of bottled water, often in lieu of tap water, home water purification systems and bulk water deliveries offer the advantages of lower cost and improved convenience compared to bottled water purchased at retail sites.

Foodservice Industry Outlook
Foodservice revenues are forecast to grow 3.7% per year to $1.3 trillion in 2027, supported by continued real recovery in the foodservice industry and trends toward eating away from home. However, advances in market value will be limited to some extent as pricing normalizes from the inflated levels of 2022.
Until 2020, growth in foodservice outlets had outpaced sales growth in beverages consumed at home. The steady increase in the share of beverage consumption held by foodservice outlets up until 2020 was the result of several factors, including:
-
generally higher incomes
-
busy lifestyles
-
increased foodservice options
-
growing availability of curbside pickup and delivery
Foodservice operators generally purchase beverages such as bottled water from major wholesale distributors which form a midpoint along the supply chain as they sell beverages to restaurants, hospitality and healthcare facilities, and other foodservice venues.
The rise of delivery options from third-party service providers (e.g., Uber Eats, DoorDash) and the convenience of ordering both carryout and delivery via an app will continue to be key to foodservice industry growth – most notably for full-service restaurants. These services broaden the potential market of customers beyond those who are able and willing to visit restaurant establishments. However, this will not benefit foodservice bottled water consumption as much as it will food consumption, as beverages are less likely to be purchased with carryout or delivery orders compared to on-premises orders.

- Executive Summary
- Figure 1-1. Bottled Water Packaging Market Outlook
- About This Report
- Report Details
- Market Scope & Product Description
- Short-Term Bottled Water Packaging Trends
- Table | annual Bottled Water Packaging Demand by Product, 2020 – 2024
- Figure 2-1. Bottled Water Packaging Demand, 2020 – 2025
- Overview
- Historical Market Trends
- Table | Bottled Water Packaging Demand, 2012 – 2022
- Figure 3-1. Bottled Water Packaging Demand, 2000 – 2022
- Packaging Product Trends
- Table | Bottled Water Packaging Demand by Product, 2012, 2017, 2022, &2027
- Table | Annual Bottled Water Packaging Demand by Product, 2019 – 2026
- Figure 3-2. Bottled Water Packaging Demand by Product, 2012, 2017, 2022, &2027
- Materials Competition
- Table | Bottled Water Packaging Demand by Material, 2012, 2017, 2022, &2027
- Table | Annual Bottled Water Packaging Demand by Material, 2019 – 2026
- Figure 3-3. Bottled Water Packaging Demand by Material, 2012, 2017, 2022, &2027
- Applications (Still Water, Sparkling Water)
- Table | Bottled Water Packaging Demand by Application, 2012, 2017, 2022, &2027
- Table | Annual Bottled Water Packaging Demand by Application, 2019 – 2026
- Figure 3-4. Bottled Water Packaging Demand by Application, 2012, 2017, 2022, &2027
- Pricing Trends
- Table | Selected Bottled Water Packaging Product Pricing, 2012, 2017, 2022, &2027
- Table | Annual Selected Bottled Water Packaging Product Pricing, 2019 – 2026
- Figure 3-5. Average Bottled Water Packaging Product Pricing, 2012 – 2027
- Foreign Trade
- Historical Market Trends
- Factors Impacting Bottled Water Packaging Demand
- Bottled Water Production Outlook
- Table | US Bottled Water Consumption & Production, 2012, 2017, 2022, &2027
- Figure 4-1. US Bottled Water Production, 2012, 2017, 2022, &2027
- Retail Sales Trends
- Foodservice Industry Outlook
- Figure 4-2. Foodservice Revenues, 2012 – 2027
- Multipack Options
- Sustainability Initiatives
- Consumer Preferences
- Beverage Packaging Priorities
- Table | Priority of Sustainability Features in Beverage Packaging, 2023
- Table | Priority of Packaging Design Features in Beverage Packaging, 2023
- Table | Priority of Packaging Sizes in Beverage Packaging, 2023
- Bottled Water Purchasing by Packaging Type
- Table | Bottled Water Purchases by Packaging Type by Age Group, 2023
- Bottled Water Purchasing by Size of Packaging
- Table | Bottled Water Purchases by Packaging Size, 2023
- Concern About Chemicals from Packaging Leaching Into Beverages
- Table | "I Am concered about chemicals from packing leaching into my Beverages by gender age group presenve
- Beverage Packaging Priorities
- Bottled Water Production Outlook
- Bottled Water Containers
- Demand by Container Type
- Table | Bottled Water Container Demand by Product, 2012, 2017, 2022, &2027
- Table | Annual Bottled Water Container Demand by Product, 2019 – 2026
- Figure 5-1. Bottled Water Container Demand by Product, 2012, 2017, 2022, &2027
- Bottles & Jugs
- Scope & Product Description
- Figure 5-2. Bottled Water Bottles & Jugs: Product Examples
- Demand by Material
- Table | Bottled Water Bottle & Jug Demand by Material, 2012, 2017, 2022, &2027
- Table | Annual Bottled Water Bottle & Jug Demand by Material 2019 – 2026
- Figure 5-3. Bottled Water Bottle & Jug Demand by Material, 2012, 2017, 2022, &2027
- Plastic Bottled Water Bottles & Jugs
- Table | Rigid Plastic Water Bottle & Jug Demand by Size, 2012, 2017, 2022, &2027
- Table | Annual Rigid Plastic Water Bottle & Jug Demand by Size, 2019 – 2026
- Glass Bottled Water Bottles & Jugs
- Table | Glass Bottled Water Bottles & Jugs Demand, 2012, 2017, 2022, &2027
- Table | Annual Glass Bottled Water Bottles & Jugs Demand, 2019 – 2026
- Other Bottle Materials
- Leading Suppliers
- Scope & Product Description
- Aluminum Cans
- Scope & Product Description
- Figure 5-4. Aluminum Bottled Water Cans: Product Examples
- Demand Outlook
- Table | Aluminum Bottled Water Can Demand, 2012, 2017, 2022, &2027
- Table | Annual Aluminum Bottled Water Can Demand, 2019 – 2026
- Leading Suppliers
- Scope & Product Description
- Other Water Containers (Pouches, Aseptic Cartons, Gable Top Cartons, Bag-in-Box Packaging)
- Scope & Product Description
- Figure 5-5. Other Containers: Product Examples
- Demand Outlook
- Table | Other Bottled Water Container Demand by Product, 2012, 2017, 2022, &2027
- Table | Annual Other Bottled Water Container Demand by Product, 2019 – 2026
- Leading Suppliers
- Scope & Product Description
- Demand by Container Type
- Multipack Packaging for Bottled Water
- Demand by Packaging Type
- Table | Bottled Water Multipack Packaging Demand by Product, 2012, 2017, 2022, &2027
- Table | Annual Bottled Water Multipack Packaging Demand by Product, 2019 – 2026
- Figure 6-1. Bottled Water Multipack Packaging Demand by Product, 2012, 2017, 2022, &2027 (billion un
- Corrugated Boxes (Packaging Boxes & Shipping Boxes)
- Scope & Product Description
- Figure 6-2. Corrugated Boxes for Bottled Water: Product Examples
- Demand Forecast
- Table | Bottled Water Corrugated Box Demand by Product, 2012, 2017, 2022, &2027
- Table | Annual Bottled Water Corrugated Box Demand by Product, 2019 – 2026
- Leading Suppliers
- Scope & Product Description
- Wrap
- Scope & Product Description
- Figure 6-3. Bottled Water Wrap: Product Examples
- Demand Forecast
- Table | Bottled Water Wrap Demand, 2012, 2017, 2022, &2027
- Table | Annual Bottled Water Wrap Demand, 2019 – 2026
- Leading Suppliers
- Scope & Product Description
- Folding Cartons (Cases)
- Scope & Product Description
- Figure 6-4. Folding Cartons for Bottled Water: Product Examples
- Demand Forecast
- Table | Bottled Water Folding Carton Demand, 2012, 2017, 2022, &2027
- Table | Annual Bottled Water Folding Carton Demand, 2019 – 2026
- Leading Suppliers
- Scope & Product Description
- Trays
- Scope & Product Description
- Figure 6-5. Bottled Water Trays: Product Examples
- Demand Forecast
- Table | Bottled Water Tray Demand, 2012, 2017, 2022, &2027
- Table | Annual Bottled Water Tray Demand, 2019 – 2026
- Scope & Product Description
- Sleeves
- Scope & Product Description
- Figure 6-6. Bottled Water Sleeves: Product Examples
- Demand Forecast
- Table | Bottled Water Sleeve Demand, 2012, 2017, 2022, &2027
- Table | Annual Bottled Water Sleeve Demand, 2019 – 2026
- Scope & Product Description
- Multipack Holders (Carrier Rings)
- Scope & Product Description
- Figure 6-7. Bottled Water Multipack Holders: Product Examples
- Demand by Type
- Table | Bottled Water Multipack Holder Demand by Product, 2012, 2017, 2022, &2027
- Table | Annual Bottled Water Multipack Holder Demand by Product, 2019 – 2026
- Scope & Product Description
- Demand by Packaging Type
- Bottled Water Closures & Labels
- Demand by Type
- Table | Bottled Water Closure & Label Demand by Type, 2012, 2017, 2022, &2027
- Table | Annual Bottled Water Closure & Label Demand by Type, 2019 – 2026
- Figure 7-1. Bottled Water Closure & Label Demand by Type, 2012, 2017, 2022, &2027
- Caps & Closures
- Scope & Product Description
- Figure 7-2. Bottled Water Caps & Closures: Product Examples
- Demand by Type
- Table | Bottled Water Cap & Closure Demand by Material, 2012, 2017, 2022, &2027
- Table | Annual Bottled Water Cap & Closure Demand by Material, 2019 – 2026
- Leading Suppliers
- Scope & Product Description
- Labels
- Scope & Product Description
- Figure 7-3. Bottled Water Labels: Product Examples
- Demand Outlook
- Table | Bottled Water Label Demand by Material, 2012, 2017, 2022, &2027
- Table | Annual Bottled Water Label Demand by Material, 2019 – 2026
- Leading Suppliers
- Scope & Product Description
- Demand by Type
- Key Suppliers & Industry Structure
- Industry Composition
- Key Suppliers
- Appendix
- Scope
- Table | Industry Codes Related to Bottled Water Packaging
- Definitions
- General
- Products
- Freedonia Methodology
- Study-Specific Methodology
- Sources
- Associations & Agencies
- Related Studies & Reports
- Macroeconomic Assumptions
- Economic Environment
- Table | Macroeconomic Indicators, 2012, 2017, 2022, &2027
- Demographic Trends
- Table | Population & Households, 2012, 2017, 2022, &2027
- Consumer Spending
- Table | Personal Consumption Expenditures & Retail Sales, 2012, 2017, 2022, &2027
- Retail Sales
- Table | Nondurable Goods Retail Sales, 2012, 2017, 2022, &2027
- Economic Environment
- Scope
Bottled water containers are usually made of plastic, but they can be glass. They are also increasingly made from aluminum, paperboard, and molded fiber.
Demand for bottled water packaging is 113 billion units.
The market size for bottled water packaging is $13.9 billion.
Top bottled water packaging companies are Altium Packaging (formerly known as Consolidated Container) , Amcor, Ardagh, Balll, Berry Global, Crown Holdings, Plastipak and Silgan.