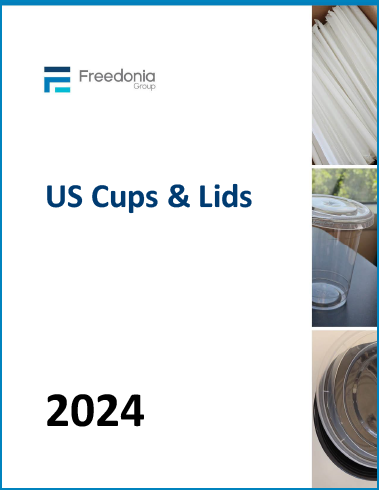
US Cups & Lids
This study examines the US market for disposable cups and lids. Historical data are provided for 2012, 2017, and 2022, with forecasts through 2032. Annual data is provided for 2018-2026.
Free Sample Report
Request a free sample of this report and our team will email it to you.
Report Overview
 What is a leading new product opportunity?
-
Aluminum beverage cups
This study examines the US market for disposable cups and lids. Historical data are provided for 2012, 2017, and 2022, with forecasts through 2032. Annual data is provided for 2018-2026. Data are provided in current dollar value and units. The study also evaluates company market share and competitive analysis on key industry competitors including Dart Container, International Paper, Graphic Packaging, Pactiv Evergreen, and Berry Global.
Featuring 145 tables and 68 figures – available in Excel and Powerpoint! Learn More
Read our blog on Aluminum Disposable Cups
Demand for disposable cups and lids in the US is forecast to grow 3.4% per year to $15.5 billion in 2027. In volume terms, demand will increase 1.8% annually to 479 billion units. Unit growth will be supported by healthy gains in foodservice revenues and the increasing popularity of single-serve, convenient food packaging. In addition to real demand gains, market value will be supported by the proliferation of higher value, sustainable cup materials such as molded fiber and aluminum.
Sustainability Has Growing Impacts on Material Mix & Product Development
Over the past decade, sustainability has become a leading factor in determining cup and lid choices. This has resulted in a strong push toward using higher priced materials such as aluminum and bioplastics, which supports market value increases. This also extends to products such as rigid plastic cups, with an emphasis placed on more environmentally friendly plastics or the greater incorporation of recycled content, which also boosts prices.
Concerns over sustainability are also creating a shift in the product mix. For instance, a general phaseout of foam cups, especially among major foodservice chains, is supporting demand for a variety of alternative materials such as paper. However, growing efforts to encourage reusable cup usage, especially among coffee shops and other limited-service restaurants, will offer a potential restraint on cup demand.
Continued Growth in Foodservice to Further Propel Cup Demand
Foodservice will continue to be an important market for disposable cups and lids due to their widespread use with hot and cold beverages, various food items, and condiments. Foodservice cup and lid demand will be supported by continued growth in foodservice orders and a return to normal consumer dining out habits. The increasing number of takeout and delivery orders at full-service restaurants, which almost exclusively used reusable glassware until recently, will also bolster gains. However, a shift at some limited-service restaurants toward bottled beverage options instead of those offered in cups will restrain greater gains.
Convenience Will Support Packaging Cup Demand Despite Maturity in Key Food Segments
Demand for packaging cups and lids will primarily benefit from the convenience they offer across various food packaging applications. In addition to widespread trends toward individual-sized food products, cups allow for on-the-go snacking as well as use with multi-pack products. However, a slowdown in key food segments, most notably flattening yogurt consumption after periods of exceptional growth, will restrain further demand going forward.
Historical Sales Trends
Demand for disposable cups and lids is directly related to trends in consumer food and beverage expenditures, particularly spending for food and beverages consumed away from home, and overall food and beverage consumption patterns.
Other important determinants of demand levels and growth include:
-
demographic factors such as the overall size and growth rate of the resident population, the age distribution of the population, the average household size, and the number of family members in the workforce
-
macroeconomic variables, such as levels of personal consumption expenditures and disposable income, and overall economic growth and inflation
-
shifts in consumer food and beverage tastes and preferences, including dietary trends
-
changes in food distribution channels and the retail environment
Cup and lid demand is also influenced by less predictable factors, such as raw material prices and availability, technological developments, government regulations, and foreign trade.
The outlook for cups and lids is also linked to overall packaging demand and various packaging industry trends, including:
-
competition from alternative packaging formats, such as other plastic or paper containers, and flexible packaging (e.g., pouches)
-
consumer preferences and purchasing trends (e.g., single serving formats, portability, reusability)
-
the importance of environmental friendliness and sustainability (e.g., recyclability and compostability)
Demand for cups and lids in the foodservice market is largely influenced by foodservice industry variables. These factors include:
-
the characteristics of various beverage products
-
shifts in consumer beverage preferences
-
portion size trends
-
menu changes by restaurants
-
design and convenience factors
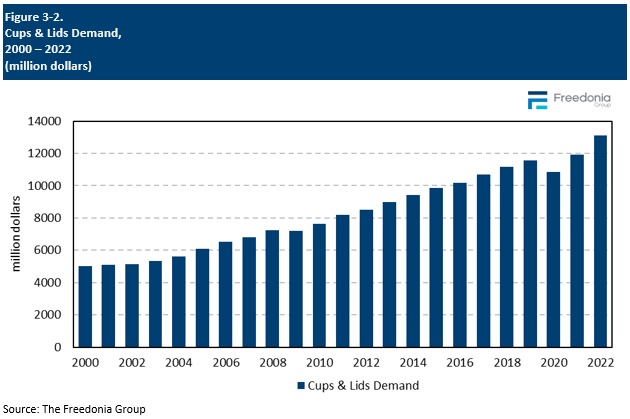
Value demand growth for cups and lids experienced a notable acceleration in 2021 and 2022 compared to previous years due to the significant inflation following supply chain issues caused by the 2020 pandemic. However, unit growth in those years was similar to historical averages as consumers remained modest in their food and drink purchases in the midst of increasing prices.
Markets Overview
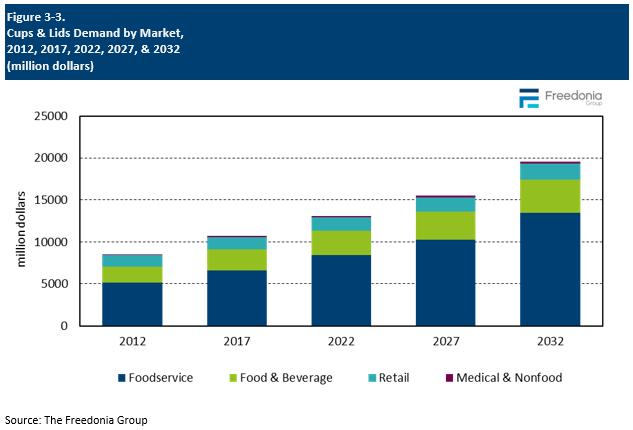
Demand for cups and lids is forecast to grow 3.4% per year to $15.5 billion in 2027, with real growth of 1.8% annually to 479 billion units. Advances will be fueled by continued growth in foodservice revenues and solid prospects for food and beverage packaging cups.
Foodservice will remain the dominant cup and lid market in value terms, accounting for 66% market value in 2027. While the large established base and maturity of some applications will hold back gains, several trends will drive cup and lid demand, especially an increased focus on specialty beverage offerings in quick service and other restaurants along with general trends toward snacking in place of traditional meals:
-
To counter declining carbonated soft drink consumption, many establishments are broadening their beverage menus by offering noncarbonated premium priced beverages such as smoothies, iced coffee, and bubble teas. This has led to increased demand for higher quality cups and lids and has lessened the impact of middling fountain drink sales.
-
Quick service restaurants and convenience stores have emphasized premium coffees, a trend that will support demand for costlier paper hot cups and specialty lids.
-
Growth in takeout and delivery services at full-service restaurants will provide a boost in cup and lid demand to a market that previously used almost exclusively reusable serviceware.
The food and beverage packaging market will benefit from the popularity and convenience of single-serving containers and healthier eating trends.
However, as newer applications become more established, the pace of packaging cup and lid demand will slow. This has already been seen in food cup markets such as coffee and tea.
Other factors that will boost foodservice cup demand in value terms include the importance of custom printing on cups and the increasing presence of higher value environmentally friendly products, such as cups made of compostable resins or incorporating significant amounts of recycled material.
In retail (home use), demand will stagnate, limited by the presence of commodity products and a significant level of seasonal demand in the retail market. However, retail sales will be somewhat supported by growing demand for more expensive environmentally friendly products.
Medical and dental uses, which constitute a small market for cups and lids, will see demand increase due to above average expansion of older age groups, which tend to have more medical and dental visits than younger groups. A rising number of medical and dental visits will translate into heightened demand for cups used for testing, holding pills, and other functions.
Applications Overview (Beverage, Food, Portion, & Packaging)
Disposable cups are used for a variety of applications, including:
-
beverage cups
-
food cups for foodservice
-
portion cups
-
packaging cups
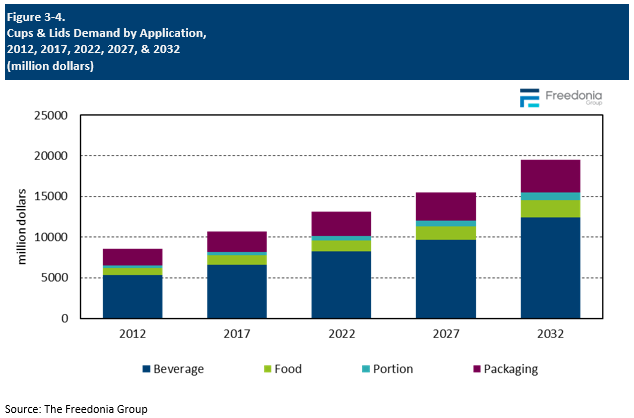
Beverage cups for the foodservice and retail markets are the leading product types, together representing more than 60% of total cup demand in value terms in 2022. The large share held by disposable beverage cups stems from their widespread use in quick service restaurants, coffee and snack shops, convenience stores, sports stadiums, movie theaters, and other locations, as well as for home use.
Demand for disposable cups and lids is expected to climb 3.4% annually to $15.5 billion in 2027, with real growth of 1.8% annually to 479 billion units.
Foodservice cup growth will be driven by growing foodservice revenues and an increase in dining away from home. Cup usage will also be supported by the increasing presence of specialty coffee in quick service chains and convenience stores, with such coffee frequently sold in costlier paper cups to convey a premium image.
Portion cups will continue to be widely used by foodservice establishments as a convenient way of containing sauces, condiments, and small food items. However, portion cups in non-foodservice applications will remain a niche product, largely used as a receptacle for medicine distribution in hospitals and nursing homes.
Solid advances are anticipated for packaging cups as a result of strong opportunities in candy and snack applications coupled with the development of new uses stemming from consumer preference for convenient and portable single serving packaging.
Read our blog on Aluminum Disposable Cups
Demand for disposable cups and lids in the US is forecast to grow 3.4% per year to $15.5 billion in 2027. In volume terms, demand will increase 1.8% annually to 479 billion units. Unit growth will be supported by healthy gains in foodservice revenues and the increasing popularity of single-serve, convenient food packaging. In addition to real demand gains, market value will be supported by the proliferation of higher value, sustainable cup materials such as molded fiber and aluminum.
Sustainability Has Growing Impacts on Material Mix & Product Development
Over the past decade, sustainability has become a leading factor in determining cup and lid choices. This has resulted in a strong push toward using higher priced materials such as aluminum and bioplastics, which supports market value increases. This also extends to products such as rigid plastic cups, with an emphasis placed on more environmentally friendly plastics or the greater incorporation of recycled content, which also boosts prices.
Concerns over sustainability are also creating a shift in the product mix. For instance, a general phaseout of foam cups, especially among major foodservice chains, is supporting demand for a variety of alternative materials such as paper. However, growing efforts to encourage reusable cup usage, especially among coffee shops and other limited-service restaurants, will offer a potential restraint on cup demand.
Continued Growth in Foodservice to Further Propel Cup Demand
Foodservice will continue to be an important market for disposable cups and lids due to their widespread use with hot and cold beverages, various food items, and condiments. Foodservice cup and lid demand will be supported by continued growth in foodservice orders and a return to normal consumer dining out habits. The increasing number of takeout and delivery orders at full-service restaurants, which almost exclusively used reusable glassware until recently, will also bolster gains. However, a shift at some limited-service restaurants toward bottled beverage options instead of those offered in cups will restrain greater gains.
Convenience Will Support Packaging Cup Demand Despite Maturity in Key Food Segments
Demand for packaging cups and lids will primarily benefit from the convenience they offer across various food packaging applications. In addition to widespread trends toward individual-sized food products, cups allow for on-the-go snacking as well as use with multi-pack products. However, a slowdown in key food segments, most notably flattening yogurt consumption after periods of exceptional growth, will restrain further demand going forward.
Historical Sales Trends
Demand for disposable cups and lids is directly related to trends in consumer food and beverage expenditures, particularly spending for food and beverages consumed away from home, and overall food and beverage consumption patterns.
Other important determinants of demand levels and growth include:
-
demographic factors such as the overall size and growth rate of the resident population, the age distribution of the population, the average household size, and the number of family members in the workforce
-
macroeconomic variables, such as levels of personal consumption expenditures and disposable income, and overall economic growth and inflation
-
shifts in consumer food and beverage tastes and preferences, including dietary trends
-
changes in food distribution channels and the retail environment
Cup and lid demand is also influenced by less predictable factors, such as raw material prices and availability, technological developments, government regulations, and foreign trade.
The outlook for cups and lids is also linked to overall packaging demand and various packaging industry trends, including:
-
competition from alternative packaging formats, such as other plastic or paper containers, and flexible packaging (e.g., pouches)
-
consumer preferences and purchasing trends (e.g., single serving formats, portability, reusability)
-
the importance of environmental friendliness and sustainability (e.g., recyclability and compostability)
Demand for cups and lids in the foodservice market is largely influenced by foodservice industry variables. These factors include:
-
the characteristics of various beverage products
-
shifts in consumer beverage preferences
-
portion size trends
-
menu changes by restaurants
-
design and convenience factors
Value demand growth for cups and lids experienced a notable acceleration in 2021 and 2022 compared to previous years due to the significant inflation following supply chain issues caused by the 2020 pandemic. However, unit growth in those years was similar to historical averages as consumers remained modest in their food and drink purchases in the midst of increasing prices.

Markets Overview
Demand for cups and lids is forecast to grow 3.4% per year to $15.5 billion in 2027, with real growth of 1.8% annually to 479 billion units. Advances will be fueled by continued growth in foodservice revenues and solid prospects for food and beverage packaging cups.
Foodservice will remain the dominant cup and lid market in value terms, accounting for 66% market value in 2027. While the large established base and maturity of some applications will hold back gains, several trends will drive cup and lid demand, especially an increased focus on specialty beverage offerings in quick service and other restaurants along with general trends toward snacking in place of traditional meals:
-
To counter declining carbonated soft drink consumption, many establishments are broadening their beverage menus by offering noncarbonated premium priced beverages such as smoothies, iced coffee, and bubble teas. This has led to increased demand for higher quality cups and lids and has lessened the impact of middling fountain drink sales.
-
Quick service restaurants and convenience stores have emphasized premium coffees, a trend that will support demand for costlier paper hot cups and specialty lids.
-
Growth in takeout and delivery services at full-service restaurants will provide a boost in cup and lid demand to a market that previously used almost exclusively reusable serviceware.
The food and beverage packaging market will benefit from the popularity and convenience of single-serving containers and healthier eating trends.
However, as newer applications become more established, the pace of packaging cup and lid demand will slow. This has already been seen in food cup markets such as coffee and tea.
Other factors that will boost foodservice cup demand in value terms include the importance of custom printing on cups and the increasing presence of higher value environmentally friendly products, such as cups made of compostable resins or incorporating significant amounts of recycled material.
In retail (home use), demand will stagnate, limited by the presence of commodity products and a significant level of seasonal demand in the retail market. However, retail sales will be somewhat supported by growing demand for more expensive environmentally friendly products.
Medical and dental uses, which constitute a small market for cups and lids, will see demand increase due to above average expansion of older age groups, which tend to have more medical and dental visits than younger groups. A rising number of medical and dental visits will translate into heightened demand for cups used for testing, holding pills, and other functions.

Applications Overview (Beverage, Food, Portion, & Packaging)
Disposable cups are used for a variety of applications, including:
-
beverage cups
-
food cups for foodservice
-
portion cups
-
packaging cups
Beverage cups for the foodservice and retail markets are the leading product types, together representing more than 60% of total cup demand in value terms in 2022. The large share held by disposable beverage cups stems from their widespread use in quick service restaurants, coffee and snack shops, convenience stores, sports stadiums, movie theaters, and other locations, as well as for home use.
Demand for disposable cups and lids is expected to climb 3.4% annually to $15.5 billion in 2027, with real growth of 1.8% annually to 479 billion units.
Foodservice cup growth will be driven by growing foodservice revenues and an increase in dining away from home. Cup usage will also be supported by the increasing presence of specialty coffee in quick service chains and convenience stores, with such coffee frequently sold in costlier paper cups to convey a premium image.
Portion cups will continue to be widely used by foodservice establishments as a convenient way of containing sauces, condiments, and small food items. However, portion cups in non-foodservice applications will remain a niche product, largely used as a receptacle for medicine distribution in hospitals and nursing homes.
Solid advances are anticipated for packaging cups as a result of strong opportunities in candy and snack applications coupled with the development of new uses stemming from consumer preference for convenient and portable single serving packaging.

- Executive Summary
- Figure 1-1. US Cups & Lids Market
- Short Term Analysis
- Economic Forecast
- Table | Macroeconomic Indicators, 2020 - 2024
- Figure 2-1. Real GDP by Economic Sector, 2020 - 2023
- Short-Term Cups & Lids Industry Trends
- Table | Annual Cups & Lids Demand by Product, 2020 - 2024
- Table | Annual Cups & Lids Demand by Application, 2020 - 2024
- Figure 2-2. Cups & Lids Demand, 2020 - 2024
- Economic Forecast
- Overview
- Study Scope
- Figure 3-1. Cups & Lids: Product Examples
- Historical Sales Trends
- Table | Cups & Lids Demand, 2012 - 2022
- Figure 3-2. Cups & Lids Demand, 2000 - 2022
- Markets Overview
- Table | Cups & Lids Demand by Market, 2012, 2017, 2022, 2027, &2032
- Table | Annual Cups & Lids Demand by Market, 2019 - 2026
- Figure 3-3. Cups & Lids Demand by Market, 2012, 2017, 2022, 2027, &2032
- Applications Overview (Beverage, Food, Portion, &Packaging)
- Table | Cups & Lids Demand by Application, 2012, 2017, 2022, 2027, &2032
- Table | Annual Cups & Lids Demand by Application, 2019 - 2026
- Figure 3-4. Cups & Lids Demand by Application, 2012, 2017, 2022, 2027, &2032
- Products Overview (Cups, Lids & Lidding)
- Table | Cups & Lids Demand by Product, 2012, 2017, 2022, 2027, &2032
- Table | Annual Cups & Lids Demand by Product, 2019 - 2026
- Figure 3-5. Cups & Lids Demand by Product, 2012, 2017, 2022, 2027, &2032
- Materials Trends (Plastic, Paper, Molded Fiber, Metal)
- Table | Cups & Lids Demand by Material, 2012, 2017, 2022, 2027, &2032
- Table | Annual Cups & Lids Demand by Material, 2019 - 2026
- Figure 3-6. Cups & Lids Demand by Material, 2012, 2017, 2022, 2027, &2032
- Pricing & Inflation
- Table | Cups & Lids Pricing by Product, 2012, 2017, 2022, 2027, &2032
- Table | Annual Cups & Lids Pricing by Product, 2019 - 2026
- Figure 3-7. Cups & Lids Pricing by Product, 2012 - 2032
- Foreign Trade
- Table | Cups & Lids Supply & Demand, 2012, 2017, 2022, 2027, &2032
- Table | Annual Cups & Lids Supply & Demand, 2019 - 2026
- Figure 3-8. US Cups & Lids Imports by Source, 2022
- Figure 3-9. US Cups & Lids Exports by Destination, 2022
- Study Scope
- Factors Impacting Cup & Lid Demand
- Foodservice Industry Outlook
- Figure 4-1. Foodservice Revenues, 2000 - 2027
- Food Packaging Trends
- Figure 4-2. Food Shipments, 2000 - 2027
- Beverage Packaging Trends
- Figure 4-3. Beverage Shipments, 2000 - 2027
- Raw Materials Use & Availability
- Regulations
- Overview
- Bans on Foam & Plastic Products
- Sustainability Initiatives
- Recycling & Recycled Content
- Source Reduction Efforts
- Development of Sustainable Materials
- Competitive Products
- Figure 4-4. Comparative Growth: Cups & Lids & Competitive Products, 2022 - 2027
- Foodservice Industry Outlook
- Rigid Plastic Cups
- Scope & Product Description
- Figure 5-1. Rigid Plastic Cups: Product Examples
- Outlook & Applications
- Table | Rigid Plastic Cups Demand by Application, 2012, 2017, 2022, 2027, &2032
- Table | Annual Rigid Plastic Cups Demand by Application, 2019 - 2026
- Figure 5-2. Rigid Plastic Cups Demand by Application, 2012, 2017, 2022, 2027, &2032
- Markets
- Table | Rigid Plastic Cups Demand by Market, 2012, 2017, 2022, 2027, &2032
- Table | Annual Rigid Plastic Cups Demand by Market, 2019 - 2026
- Figure 5-3. Rigid Plastic Cups Demand by Market, 2012, 2017, 2022, 2027, &2032
- Product Innovation
- Leading Suppliers
- Scope & Product Description
- Foam Cups
- Scope & Product Description
- Figure 6-1. Foam Cups: Product Examples
- Outlook & Applications
- Table | Foam Cups Demand by Application, 2012, 2017, 2022, 2027, &2032
- Table | Annual Foam Cups Demand by Application, 2019 - 2026
- Figure 6-2. Foam Cups Demand by Application, 2012, 2017, 2022, 2027, &2032
- Markets
- Table | Foam Cups Demand by Market, 2012, 2017, 2022, 2027, &2032
- Table | Annual Foam Cups Demand by Market, 2019 - 2026
- Figure 6-3. Foam Cups Demand by Market, 2012, 2017, 2022, 2027, &2032
- Product Innovation
- Leading Suppliers
- Scope & Product Description
- Paper Cups
- Scope & Product Description
- Figure 7-1. Paper Cups: Product Examples
- Outlook & Applications
- Table | Paper Cups Demand by Application, 2012, 2017, 2022, 2027, &2032
- Table | Annual Paper Cups Demand by Application, 2019 - 2026
- Figure 7-2. Paper Cups Demand by Application, 2012, 2017, 2022, 2027, &2032
- Markets
- Table | Paper Cups Demand by Market, 2012, 2017, 2022, 2027, &2032
- Table | Annual Paper Cups Demand by Market, 2019 - 2026
- Figure 7-3. Paper Cups Demand by Market, 2012, 2017, 2022, 2027, &2032
- Product Innovation
- Leading Suppliers
- Scope & Product Description
- Molded Fiber Cups
- Scope & Product Description
- Figure 8-1. Molded Fiber Cups: Product Examples
- Outlook & Applications
- Table | Molded Fiber Cups Demand by Application, 2012, 2017, 2022, 2027, &2032
- Table | Annual Molded Fiber Cups Demand by Application, 2019 - 2026
- Figure 8-2. Molded Fiber Cups Demand by Application, 2012, 2017, 2022, 2027, &2032
- Markets
- Table | Molded Fiber Cups Demand by Market, 2012, 2017, 2022, 2027, &2032
- Table | Annual Molded Fiber Cups Demand by Market, 2019 - 2026
- Figure 8-3. Molded Fiber Cups Demand by Market, 2012, 2017, 2022, 2027, &2032
- Product Innovation
- Leading Suppliers
- Scope & Product Description
- Metal Cups
- Scope & Product Description
- Figure 9-1. Metal Cups: Product Examples
- Outlook & Applications
- Table | Metal Cup Demand by Application, 2012, 2017, 2022, 2027, &2032
- Table | Annual Metal Cup Demand by Application, 2019 - 2026
- Figure 9-2. Metal Cup Demand by Application, 2012, 2017, 2022, 2027, &2032
- Markets
- Table | Metal Cup Demand by Market, 2012, 2017, 2022, 2027, &2032
- Table | Annual Metal Cup Demand by Market, 2019 - 2026
- Figure 9-3. Metal Cup Demand by Market, 2012, 2017, 2022, 2027, &2032
- Product Innovation
- Leading Suppliers
- Scope & Product Description
- Lids & Lidding
- Scope & Product Description
- Figure 10-1. Lids & Lidding: Product Examples
- Outlook, Products & Applications
- Demand by Product
- Table | Lids & Lidding Demand by Product, 2012, 2017, 2022, 2027, &2032
- Table | Annual Lids & Lidding Demand by Product, 2019 - 2026
- Figure 10-2. Lids & Lidding Demand by Product, 2012, 2017, 2022, 2027, &2032
- Demand by Application
- Table | Lids & Lidding Demand by Application, 2012, 2017, 2022, 2027, &2032
- Table | Annual Lids & Lidding Demand by Application, 2019 - 2026
- Figure 10-3. Lids & Lidding Demand by Application, 2012, 2017, 2022, 2027, &2032
- Rigid Lids
- Table | Rigid Cup Lids Demand by Market & Material, 2012, 2017, 2022, 2027, &2032
- Table | Annual Rigid Cup Lids Demand by Market & Material, 2019 - 2026
- Lidding (Flexible Lids)
- Table | Cup Lidding Demand by Market & Material, 2012, 2017, 2022, 2027, &2032
- Table | Annual Cup Lidding Demand by Market & Material, 2019 - 2026
- Demand by Product
- Materials
- Table | Lids & Lidding Demand by Material, 2012, 2017, 2022, 2027, &2032
- Table | Annual Lids & Lidding Demand by Material, 2019 - 2026
- Figure 10-4. Lids & Lidding Demand by Material, 2012, 2017, 2022, 2027, &2032
- Markets
- Table | Lids & Lidding Demand by Market, 2012, 2017, 2022, 2027, &2032
- Table | Annual Lids & Lidding Demand by Market, 2019 - 2026
- Figure 10-5. Lids & Lidding Demand by Market, 2012, 2017, 2022, 2027, &2032
- Product Innovation
- Leading Suppliers
- Scope & Product Description
- Beverage Cups & Lids
- Scope & Product Description
- Figure 11-1. Beverage Cups & Lids: Product Examples
- Demand Outlook
- Table | Drinking Cups & Lids Demand by Product, 2012, 2017, 2022, 2027, &2032
- Table | Annual Drinking Cups & Lids Demand by Product, 2019 - 2026
- Figure 11-2. Drinking Cups & Lids Demand by Product, 2012, 2017, 2022, 2027, &2032
- Beverage Cups
- Demand by Type
- Table | Beverage Cup Demand: Cold vs Hot, 2012, 2017, 2022, 2027, &2032
- Table | Annual Beverage Cup Demand: Cold vs Hot, 2019 - 2026
- Figure 11-3. Beverage Cup Demand: Cold vs Hot, 2012, 2017, 2022, 2027, &2032
- Cold Cups
- Table | Cold Drinking Cup Demand by Market & Material, 2012, 2017, 2022, 2027, &2032
- Table | Annual Cold Drinking Cup Demand by Market & Material, 2019 - 2026
- Hot Cups
- Table | Hot Drinking Cup Demand by Market & Material, 2012, 2017, 2022, 2027, &2032
- Table | Annual Hot Drinking Cup Demand by Market & Material, 2019 - 2026
- Demand by Type
- Lids for Beverage Cups
- Demand by Type
- Table | Drinking Cup Lid Demand by Type 2012, 2017, 2022, 2027, &2032
- Table | Annual Drinking Cup Lid Demand by Type, 2019 - 2026
- Figure 11-4. Drinking Cup Lid Demand by Type, 2012, 2017, 2022, 2027, &2032
- Standard Lids
- Specialty Lids
- Demand by Type
- Materials
- Table | Drinking Cups & Lids Demand by Material, 2012, 2017, 2022, 2027, &2032
- Table | Annual Drinking Cups & Lids Demand by Material, 2019 - 2026
- Figure 11-5. Drinking Cups & Lids Demand by Material, 2012, 2017, 2022, 2027, &2032
- Markets
- Table | Drinking Cups & Lids Demand by Market, 2012, 2017, 2022, 2027, &2032
- Table | Annual Drinking Cups & Lids Demand by Market, 2019 - 2026
- Figure 11-6. Drinking Cups & Lids Demand by Market, 2012, 2017, 2022, 2027, &2032
- Leading Suppliers
- Scope & Product Description
- Food Cups & Lids
- Scope & Product Description
- Figure 12-1. Food Cups & Lids: Product Examples
- Demand Outlook
- Table | Food Cups & Lids Demand by Product, 2012, 2017, 2022, 2027, &2032
- Table | Annual Food Cups & Lids Demand by Product, 2019 - 2026
- Figure 12-2. Food Cups & Lids Demand by Product, 2012, 2017, 2022, 2027, &2032
- Materials
- Table | Food Cups & Lids Demand by Material, 2012, 2017, 2022, 2027, &2032
- Table | Annual Food Cups & Lids Demand by Material, 2019 - 2026
- Figure 12-3. Food Cups & Lids Demand by Material, 2012, 2017, 2022, 2027, &2032
- Markets
- Table | Food Cups & Lids Demand by Market, 2012, 2017, 2022, 2027, &2032
- Table | Annual Food Cups & Lids Demand by Market, 2019 - 2026
- Figure 12-4. Food Cups & Lids Demand by Market, 2012, 2017, 2022, 2027, &2032
- Leading Suppliers
- Scope & Product Description
- Portion Cups & Lids
- Scope & Product Description
- Figure 13-1. Portion Cups & Lids: Product Examples
- Demand Outlook
- Table | Portion Cups & Lids Demand by Product, 2012, 2017, 2022, 2027, &2032
- Table | Annual Portion Cups & Lids Demand by Product, 2019 - 2026
- Figure 13-2. Portion Cups & Lids Demand by Product, 2012, 2017, 2022, 2027, &2032
- Materials
- Table | Portion Cups & Lids Demand by Material, 2012, 2017, 2022, 2027, &2032
- Table | Annual Portion Cups & Lids Demand by Material, 2019 - 2026
- Figure 13-3. Portion Cups & Lids Demand by Material, 2012, 2017, 2022, 2027, &2032
- Markets
- Table | Portion Cups & Lids Demand by Market, 2012, 2017, 2022, 2027, &2032
- Table | Annual Portion Cups & Lids Demand by Market, 2019 - 2026
- Figure 13-4. Portion Cups & Lids Demand by Market, 2012, 2017, 2022, 2027, &2032
- Leading Suppliers
- Scope & Product Description
- Packaging Cups & Lids
- Scope & Product Description
- Figure 14-1. Packaging Cups & Lids: Product Examples
- Demand Outlook
- Table | Packaging Cups & Lids Demand by Product, 2012, 2017, 2022, 2027, &2032
- Table | Annual Packaging Cups & Lids Demand by Product, 2019 - 2026
- Figure 14-2. Packaging Cups & Lids Demand by Product, 2012, 2017, 2022, 2027, &2032
- Materials
- Table | Packaging Cups & Lids Demand by Material, 2012, 2017, 2022, 2027, &2032
- Table | Annual Packaging Cups & Lids Demand by Material, 2019 - 2026
- Figure 14-3. Packaging Cups & Lids Demand by Material, 2012, 2017, 2022, 2027, &2032
- Markets
- Table | Packaging Cups & Lids Demand by Market, 2012, 2017, 2022, 2027, &2032
- Table | Annual Packaging Cups & Lids Demand by Market, 2019 - 2026
- Figure 14-4. Packaging Cups & Lids Demand by Market, 2012, 2017, 2022, 2027, &2032
- Leading Suppliers
- Scope & Product Description
- Foodservice Markets
- Market Scope
- Markets Overview
- Demand by Market
- Table | Foodservice Cups & Lids Demand by Market, 2012, 2017, 2022, 2027, &2032
- Table | Annual Foodservice Cups & Lids Demand by Market, 2019 - 2026
- Table | Foodservice Beverage Cup Demand by Beverage Type, 2012, 2017, 2022, 2027, &2032
- Table | Annual Foodservice Beverage Cup Demand by Beverage Type, 2019 - 2026
- Figure 15-1. Foodservice Cups & Lids Demand by Market, 2012, 2017, 2022, 2027, &2032
- Fast Food & Fast Casual
- Table | Fast Food & Fast Casual Restaurant Cups & Lids Demand by Product & Application, 2012, 2017, 2022, 20
- Table | Annual Fast Food & Fast Casual Restaurant Cups & Lids Demand by Product & Application, 2019 - 2026
- Other Limited Service Restaurants (Coffee Shops, Snack Shops, Street Vendors)
- Table | Other Limited Service Restaurant Cups & Lids Demand by Product & Application, 2012, 2017, 2022, 2027
- Table | Annual Other Limited Service Restaurant Cups & Lids Demand by Product & Application, 2019 - 2026
- Full-Service
- Table | Full-Service Restaurant Cups & Lids Demand by Product & Application, 2012, 2017, 2022, 2027, &2032
- Table | Annual Full-Service Restaurant Cups & Lids Demand by Product & Application, 2019 - 2026
- Non-Commercial Foodservice
- Table | Non-Commercial Foodservice Cups & Lids Demand by Product & Application, 2012, 2017, 2022, 2027, &203
- Table | Annual Non-Commercial Foodservice Cups & Lids Demand by Product & Application, 2019 - 2026
- Demand by Market
- Products & Applications
- Table | Foodservice Cups & Lids Demand by Product & Application, 2012, 2017, 2022, 2027, &2032
- Table | Annual Foodservice Cups & Lids Demand by Product & Application, 2019 - 2026
- Figure 15-2. Foodservice Cups & Lids Demand by Product, 2012, 2017, 2022, 2027, &2032
- Materials
- Table | Foodservice Cups & Lids Demand by Material, 2012, 2017, 2022, 2027, &2032
- Table | Annual Foodservice Cups & Lids Demand by Material, 2019 - 2026
- Figure 15-3. Foodservice Cups & Lids Demand by Material, 2012, 2017, 2022, 2027, &2032
- Food & Beverage Packaging Markets
- Market Scope
- Markets Overview
- Demand by Market
- Table | Food Packaging Cups & Lids Demand by Market, 2012, 2017, 2022, 2027, &2032
- Table | Annual Food Packaging Cups & Lids Demand by Market, 2019 - 2026
- Figure 16-1. Food & Beverage Packaging Cups & Lids Demand by Market, 2012, 2017, 2022, 2027, &2032
- Dairy Products
- Table | Dairy Packaging Cups & Lids Demand by Product & Food Type, 2012, 2017, 2022, 2027, &2032
- Table | Annual Dairy Packaging Cups & Lids Demand by Product & Food Type, 2019 - 2026
- Prepared Foods
- Table | Prepared Food Packaging Cups & Lids Demand by Product, 2012, 2017, 2022, 2027, &2032
- Table | Annual Prepared Food Packaging Cups & Lids Demand by Product, 2019 - 2026
- Sauces, Condiments, &Dressings
- Table | Sauces, Condiments, &Dressings Cups & Lids Demand by Product, 2012, 2017, 2022, 2027, &2032
- Table | Annual Sauces, Condiments, &Dressings Cups & Lids Demand by Product, 2019 - 2026
- Fruits & Vegetables
- Table | Processed Fruits & Vegetables Cups & Lids Demand by Product, 2012, 2017, 2022, 2027, &2032
- Table | Annual Processed Fruits & Vegetables Cups & Lids Demand by Product, 2019 - 2026
- Coffee & Tea
- Table | Coffee & Tea Cups & Lids Demand by Product, 2012, 2017, 2022, 2027, &2032
- Table | Annual Coffee & Tea Cups & Lids Demand by Product, 2019 - 2026
- Dry Food (Dry Soups, Side Dishes, &Breakfast Cereals)
- Table | Dry Food Cups & Lids Demand by Product, 2012, 2017, 2022, 2027, &2032
- Table | Annual Dry Food Cups & Lids Demand by Product, 2019 - 2026
- Candy & Snacks
- Table | Candy & Snack Cups & Lids Demand by Product, 2012, 2017, 2022, 2027, &2032
- Table | Annual Candy & Snack Cups & Lids Demand by Product, 2019 - 2026
- Baby Food
- Table | Baby Food Cups & Lids Demand by Product, 2012, 2017, 2022, 2027, &2032
- Table | Annual Baby Food Cups & Lids Demand by Product, 2019 - 2026
- Other Foods
- Table | Other Food Packaging Cups & Lids Demand by Product, 2012, 2017, 2022, 2027, &2032
- Table | Annual Other Food Packaging Cups & Lids Demand by Product, 2019 - 2026
- Beverages
- Table | Beverage Packaging Cups & Lids Demand by Product, 2012, 2017, 2022, 2027, &2032
- Table | Annual Beverage Packaging Cups & Lids Demand by Product, 2019 - 2026
- Demand by Market
- Product Trends
- Table | Food & Beverage Packaging Cups & Lids Demand by Product, 2012, 2017, 2022, 2027, &2032
- Table | Annual Food & Beverage Packaging Cups & Lids Demand by Product, 2019 - 2026
- Figure 16-2. Food & Beverage Packaging Cups & Lids Demand by Product, 2012, 2017, 2022, 2027, &2032
- Materials
- Table | Food & Beverage Packaging Cups & Lids Demand by Material, 2012, 2017, 2022, 2027, &2032
- Table | Annual Food & Beverage Packaging Cups & Lids Demand by Material, 2019 - 2026
- Figure 16-3. Food & Beverage Packaging Cups & Lids Demand by Material, 2012, 2017, 2022, 2027, &2032
- Retail, Medical, &Nonfood Packaging Markets
- Markets Overview
- Demand by Market
- Table | Retail & Other Markets Cups & Lids Demand by Market, 2012, 2017, 2022, 2027, &2032
- Table | Annual Retail & Other Markets Cups & Lids Demand by Market, 2019 - 2026
- Figure 17-1. Retail & Other Markets Cups & Lids Demand by Market, 2012, 2017, 2022, 2027, &2032
- Retail Sale/Home Use
- Table | Retail/Home Use Cups & Lids Demand by Product, 2012, 2017, 2022, 2027, &2032
- Table | Annual Retail/Home Use Cups & Lids Demand by Product, 2019 - 2026
- Medical & Dental Markets
- Table | Medical & Dental Cups & Lids Demand by Product, 2012, 2017, 2022, 2027, &2032
- Table | Annual Medical & Dental Cups & Lids Demand by Product, 2019 - 2026
- Pet Food & Treats
- Table | Pet Food & Treats Cups & Lids Demand by Product, 2012, 2017, 2022, 2027, &2032
- Table | Annual Pet Food & Treats Cups & Lids Demand by Product, 2019 - 2026
- Nonfood Packaging
- Table | Nonfood Packaging Cups & Lids Demand by Product, 2012, 2017, 2022, 2027, &2032
- Table | Annual Nonfood Packaging Cups & Lids Demand by Product, 2019 - 2026
- Demand by Market
- Product Trends
- Table | Retail & Other Markets Cups & Lids Demand by Product, 2012, 2017, 2022, 2027, &2032
- Table | Annual Retail & Other Markets Cups & Lids Demand by Product, 2019 - 2026
- Figure 17-2. Retail & Other Markets Cups & Lids Demand by Product, 2012, 2017, 2022, 2027, &2032
- Materials
- Table | Retail & Other Markets Cups & Lids Demand by Material, 2012, 2017, 2022, 2027, &2032
- Table | Annual Retail & Other Markets Cups & Lids Demand by Material, 2019 - 2026
- Figure 17-3. Retail & Other Markets Cups & Lids Demand by Material, 2012, 2017, 2022, 2027, &2032
- Markets Overview
- Industry Structure
- Key Findings & Industry Composition
- Table | US Cups & Lids Sales by Company, 2022
- Market Share
- Figure 18-1. US Cups & Lids Market Share by Company, 2022
- Figure 18-2. US Cups & Lids Market: Leading Supplier, 2022
- Figure 18-3. US Cups & Lids Market: Second Leading Supplier, 2022
- Figure 18-4. US Cups & Lids Market: Third Leading Supplier, 2022
- Figure 18-5. US Cups & Lids Market: Fourth Leading Supplier, 2022
- Mergers & Acquisitions
- Table | Selected Mergers & Acquisitions
- List of Industry Participants
- Table | List of Industry Participants
- Key Findings & Industry Composition
- Appendix
- Report Details
- Table | Relevant Industry Codes
- Table | Relevant HS Codes
- Definitions
- Abbreviations
- Table | Abbreviations & Acronyms Used in Study
- Freedonia Methodology
- Study-Specific Methodology
- Data Changes from Previous Version
- Sources
- Associations & Agencies
- Related Studies & Reports
- Macroeconomic Assumptions
- Economic Environment
- Table | Macroeconomic Indicators, 2012 - 2032
- Demographic Trends
- Table | Population & Households, 2012 - 2032
- Consumer Spending
- Table | Personal Consumption Expenditures, 2012, 2017, 2022, 2027, &2032
- Economic Environment
- Report Details
Medical and dental uses, which constitute a small market for cups and lids, will see demand increase due to above average expansion of older age groups, which tend to have more medical and dental visits than younger groups.
Foodservice revenues are forecast to rise 5.0% per year to $1.6 trillion in 2027. Growth will result from continued real recovery in the foodservice industry and trends toward eating away from home.
Sustainability-oriented materials will see the fastest gains.
The four leading companies for cups & lids include Dart Container, Graphic Packaging, Pactiv Evergreen, and Berry Global.