US Molded Fiber Packaging
This study examines the US market for molded fiber packaging, which is defined as rigid packaging formed from fibrous materials using wet or dry processes. Historical data are provided for 2012, 2017, and 2022, with forecasts through 2032. Annual data is provided for 2018-2026. Also provided is an analysis of key industry players.
Free Sample Report
Request a free sample of this report and our team will email it to you.
Report Overview
In need of comprehensive data for uses of molded fiber in packaging?
-
Molded fiber is one of the highest growth materials in packaging due to the increasing importance of sustainability.
Learn more here…
This study examines the US market for molded fiber packaging, 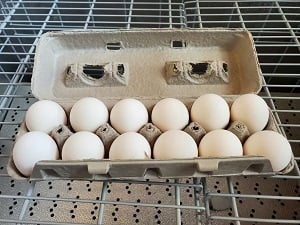 which is defined as rigid packaging formed from fibrous materials using wet or dry processes. Nonpackaging products – such as nursery pots and bedpans – are also covered. Historical data are provided for 2012, 2017, and 2022, with forecasts through 2032. Annual data is provided for 2018-2026. Also provided is an analysis of key industry players.
Featuring 143 tables and 45 figures – available in Excel and Powerpoint! Learn More
This report includes data from 2011-2031 in 5 year intervals and tables featuring year-by-year data for 2018-2025.
The US market for molded fiber packaging continues to see strong growth attributable to an increased focus on sustainability initiatives, technological improvements, new product introductions, and longer-running market trends all combining to increase market size and breadth. Demand for molded fiber packaging is forecast to rise 7.8% annually to $3.0 billion in 2027, with real growth of 8.2% yearly to 2.46 billion units. Gains will be supported by multiple factors:
- Molded fiber will continue to benefit from its image of sustainability, being recyclable, compostable, biodegradable, and increasingly made from agricultural waste.
- Performance and aesthetic improvements will boost demand, particularly for packaging of higher end products such as cosmetics and electronics.
- Developments in coatings and additives will increases the number of applications for molded fiber, including high-temperature and oily products.
- Advances in manufacturing and tooling processes will continue to lower the cost of molded fiber production, especially for those sourced from alternative fibers.
- New products are being introduced to the market, such as molded fiber beverage bottles.
Molded Fiber Continues to Take Share from Conventional Plastic- & Paper-Based Packaging
Owing to its favorable sustainability profile and increasing cost competitiveness, molded fiber packaging is expected to keep taking share from conventional plastic and foam iterations. In addition to being recyclable, molded fiber is compostable and biodegradable. It is also increasingly made of nonwood fiber sources that enhance its sustainability profile.Read our blog on the Molded Fiber Packaging Market
Nonwood Fibers Expected to See Especially Strong Growth Due to Increasing Availability
Though molded wood pulp products are expected to see strong growth going forward, products sourced from alternative fibers – including sugarcane, wheat straw, bamboo, and various grasses – are expected to see the largest gains due their superior renewability and image of sustainability, as they are not sourced from trees – as well as improved aesthetics and increasing cost competitiveness. Wheat straw, for example, is often chosen for its darker shade compared to other materials. Recent manufacturing advances allow these fibers to be molded into wider varieties of shapes and forms, increasing the number of applications in which they can be used.Foodservice Molded Fiber Products to Continue to Post Largest Gains
Foodservice is by far the largest market for molded fiber packaging and serviceware. Over the past decade, sustainability has become increasingly important for both high-profile foodservice outlets and smaller restaurants wishing to appeal to younger clientele. Gains will benefit from continued growth of existing molded fiber products – including dinnerware, clamshells, and two-piece containers – and the penetration of new ones like cups, lids, and cutlery. Gains will also be supported by improvements in coatings and additives used with molded fiber packaging, thereby allowing use with a wider variety of foods and beverages. Local bans on EPS packaging and restaurants’ continued focus on delivery and carryout services, which are more packaging intensive, will both support growth.Historical Market Trends
At the highest level, demand for molded fiber packaging is driven by trends in its primary markets – foodservice and food, and increasingly retail and nonfood – which is an indicator of the number of potential packaging applications. In turn, growth in these markets is dependent on multiple macroeconomic and demographic factors; they include:
- Trends in food consumption and the mix of food eaten at home versus away from home
- The health of the overall economy and levels of disposable income, which impact the ability of consumers to spend on restaurants, as well as sustainably packaged products, which tend to be higher cost
- Changes in the population mix, especially in terms of age cohorts (such as young adults) who are likely to eat out more often and be more environmentally conscious
- The share of total restaurant orders that are provided via drive-thru, curbside pickup, carryout, or delivery services, as these are more likely to be packaged in two-piece containers and clamshells, two of the largest molded fiber products
- Social factors such as health concerns, as restaurants focused on healthy foods are more likely to use sustainable packaging
- Sustainability initiatives, which impact the overall level of packaging used as well as the types of products and materials used
- Regulations, especially restrictions on specific materials or types of disposables
Following the pandemic, the foodservice industry recovered with an increased focus on takeout and delivery options. Additionally, businesses were able reinitiate sustainability efforts as supply chain issues began to subside.
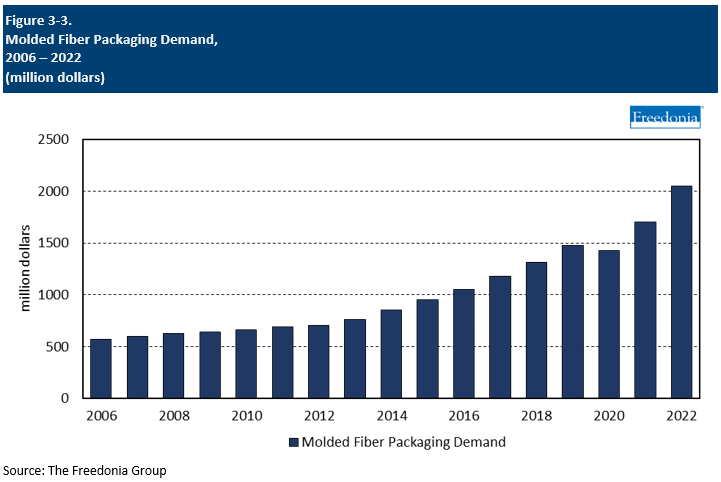
These factors strongly increased real demand of molded fiber products in 2021 and 2022. Furthermore, high inflation in 2021 and 2022 further propped up increases in value demand.
Molded Fiber Supply & Demand
Demand Overview
Manufacturers of food products and consumer and industrial packaged goods are increasingly implementing strategies to improve their environmental footprints, as commitments to eco-friendliness are important to many of their customers. In addition to packaging reduction strategies, a key means of improving sustainability has been the use of more environmentally friendly materials, such as molded fiber.In addition to trends favoring molded fiber packaging’s excellent environmental profile, key factors supporting strong demand increases include:
- The development of molded fiber products that are more competitive with plastic alternatives in terms of cost, performance, and aesthetics
- Backlash against single-use plastic products manufactured from expanded polystyrene (EPS) foam, as well as bans on certain EPS foodservice products in a growing number of cities
- Increasing domestic manufacturing capacity for molded fiber, which will help make prices more competitive
- Healthy growth in several key applications for molded fiber, including foodservice and food packaging
- Research and development of new applications for molded fiber, specifically in nonfood packaging markets
- Improvements in coatings and additives for molded fiber, increasing the breadth of applications with which it can be used
- Ongoing elevated prices for some molded fiber packaging products, compared to competitive materials such as conventional plastic and corrugated paper
- Concerns about the presence of per- and polyfluoroalkyl substances (PFAS) – used in molded fiber packaging for water and grease resistance – as these chemicals can potentially pose health concerns and do not biodegrade
- Generally modest increases in the domestic production of eggs, fruit, and vegetables – chief markets for traditional molded wood pulp packaging
Trade Balance
International trade is an important part of the molded fiber packaging industry, particularly in the foodservice segment.
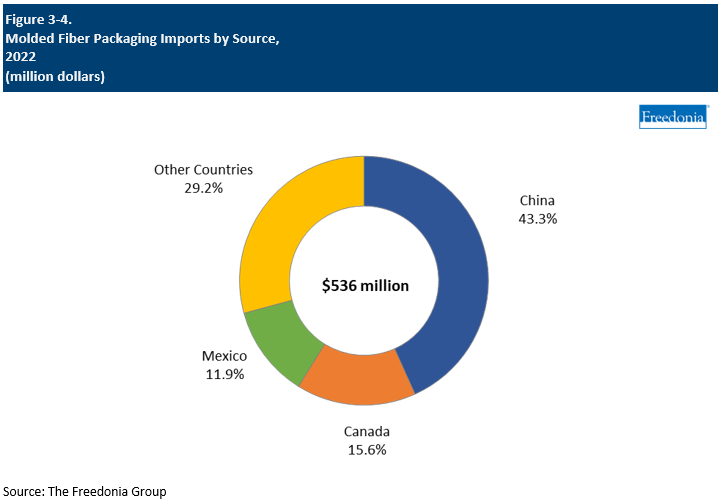
Manufacturers in Asia are a major source of molded fiber foodservice products that are sold to customers in the US. Unlike suppliers in Asia, domestic molded fiber producers are typically focused on manufacturing food and protective packaging.
Asia – particularly China – is a key source for molded fiber products made from bagasse, the pulpy residue leftover from processing sugarcane crops.
- Supplies of bagasse are high in countries with large sugar production industries – including China, Brazil, Thailand, and Vietnam.
- Production of food packaging items made from bagasse has expanded quickly in these countries, largely due to growing global demand for environmentally friendly foodservice disposables.
Numerous foodservice packaging suppliers operating in the US purchase molded fiber products from Asian manufacturers, then resell them via private label to domestic customers. Sales of these imported products are included in demand totals as well as in company market share estimates for the purposes of this study.
The majority of US production is for domestic use, with a small amount exported, primarily to Canada and Mexico. Historically, much of these exports were for protective packaging and commodity food packaging products such as egg cartons and trays. However, as the US increasingly adopts newer dry pulp technology and domestic production expands to include a wider breadth of products, exports are forecast to increase significantly.
The US market for molded fiber packaging continues to see strong growth attributable to an increased focus on sustainability initiatives, technological improvements, new product introductions, and longer-running market trends all combining to increase market size and breadth. Demand for molded fiber packaging is forecast to rise 7.8% annually to $3.0 billion in 2027, with real growth of 8.2% yearly to 2.46 billion units. Gains will be supported by multiple factors:
- Molded fiber will continue to benefit from its image of sustainability, being recyclable, compostable, biodegradable, and increasingly made from agricultural waste.
- Performance and aesthetic improvements will boost demand, particularly for packaging of higher end products such as cosmetics and electronics.
- Developments in coatings and additives will increases the number of applications for molded fiber, including high-temperature and oily products.
- Advances in manufacturing and tooling processes will continue to lower the cost of molded fiber production, especially for those sourced from alternative fibers.
- New products are being introduced to the market, such as molded fiber beverage bottles.
Molded Fiber Continues to Take Share from Conventional Plastic- & Paper-Based Packaging
Owing to its favorable sustainability profile and increasing cost competitiveness, molded fiber packaging is expected to keep taking share from conventional plastic and foam iterations. In addition to being recyclable, molded fiber is compostable and biodegradable. It is also increasingly made of nonwood fiber sources that enhance its sustainability profile.Read our blog on the Molded Fiber Packaging Market
Nonwood Fibers Expected to See Especially Strong Growth Due to Increasing Availability
Though molded wood pulp products are expected to see strong growth going forward, products sourced from alternative fibers – including sugarcane, wheat straw, bamboo, and various grasses – are expected to see the largest gains due their superior renewability and image of sustainability, as they are not sourced from trees – as well as improved aesthetics and increasing cost competitiveness. Wheat straw, for example, is often chosen for its darker shade compared to other materials. Recent manufacturing advances allow these fibers to be molded into wider varieties of shapes and forms, increasing the number of applications in which they can be used.Foodservice Molded Fiber Products to Continue to Post Largest Gains
Foodservice is by far the largest market for molded fiber packaging and serviceware. Over the past decade, sustainability has become increasingly important for both high-profile foodservice outlets and smaller restaurants wishing to appeal to younger clientele. Gains will benefit from continued growth of existing molded fiber products – including dinnerware, clamshells, and two-piece containers – and the penetration of new ones like cups, lids, and cutlery. Gains will also be supported by improvements in coatings and additives used with molded fiber packaging, thereby allowing use with a wider variety of foods and beverages. Local bans on EPS packaging and restaurants’ continued focus on delivery and carryout services, which are more packaging intensive, will both support growth.Historical Market Trends
At the highest level, demand for molded fiber packaging is driven by trends in its primary markets – foodservice and food, and increasingly retail and nonfood – which is an indicator of the number of potential packaging applications. In turn, growth in these markets is dependent on multiple macroeconomic and demographic factors; they include:
- Trends in food consumption and the mix of food eaten at home versus away from home
- The health of the overall economy and levels of disposable income, which impact the ability of consumers to spend on restaurants, as well as sustainably packaged products, which tend to be higher cost
- Changes in the population mix, especially in terms of age cohorts (such as young adults) who are likely to eat out more often and be more environmentally conscious
- The share of total restaurant orders that are provided via drive-thru, curbside pickup, carryout, or delivery services, as these are more likely to be packaged in two-piece containers and clamshells, two of the largest molded fiber products
- Social factors such as health concerns, as restaurants focused on healthy foods are more likely to use sustainable packaging
- Sustainability initiatives, which impact the overall level of packaging used as well as the types of products and materials used
- Regulations, especially restrictions on specific materials or types of disposables
Following the pandemic, the foodservice industry recovered with an increased focus on takeout and delivery options. Additionally, businesses were able reinitiate sustainability efforts as supply chain issues began to subside.
These factors strongly increased real demand of molded fiber products in 2021 and 2022. Furthermore, high inflation in 2021 and 2022 further propped up increases in value demand.

Molded Fiber Supply & Demand
Demand Overview
Manufacturers of food products and consumer and industrial packaged goods are increasingly implementing strategies to improve their environmental footprints, as commitments to eco-friendliness are important to many of their customers. In addition to packaging reduction strategies, a key means of improving sustainability has been the use of more environmentally friendly materials, such as molded fiber.In addition to trends favoring molded fiber packaging’s excellent environmental profile, key factors supporting strong demand increases include:
- The development of molded fiber products that are more competitive with plastic alternatives in terms of cost, performance, and aesthetics
- Backlash against single-use plastic products manufactured from expanded polystyrene (EPS) foam, as well as bans on certain EPS foodservice products in a growing number of cities
- Increasing domestic manufacturing capacity for molded fiber, which will help make prices more competitive
- Healthy growth in several key applications for molded fiber, including foodservice and food packaging
- Research and development of new applications for molded fiber, specifically in nonfood packaging markets
- Improvements in coatings and additives for molded fiber, increasing the breadth of applications with which it can be used
- Ongoing elevated prices for some molded fiber packaging products, compared to competitive materials such as conventional plastic and corrugated paper
- Concerns about the presence of per- and polyfluoroalkyl substances (PFAS) – used in molded fiber packaging for water and grease resistance – as these chemicals can potentially pose health concerns and do not biodegrade
- Generally modest increases in the domestic production of eggs, fruit, and vegetables – chief markets for traditional molded wood pulp packaging
Trade Balance
International trade is an important part of the molded fiber packaging industry, particularly in the foodservice segment.
Manufacturers in Asia are a major source of molded fiber foodservice products that are sold to customers in the US. Unlike suppliers in Asia, domestic molded fiber producers are typically focused on manufacturing food and protective packaging.
Asia – particularly China – is a key source for molded fiber products made from bagasse, the pulpy residue leftover from processing sugarcane crops.
- Supplies of bagasse are high in countries with large sugar production industries – including China, Brazil, Thailand, and Vietnam.
- Production of food packaging items made from bagasse has expanded quickly in these countries, largely due to growing global demand for environmentally friendly foodservice disposables.
Numerous foodservice packaging suppliers operating in the US purchase molded fiber products from Asian manufacturers, then resell them via private label to domestic customers. Sales of these imported products are included in demand totals as well as in company market share estimates for the purposes of this study.
The majority of US production is for domestic use, with a small amount exported, primarily to Canada and Mexico. Historically, much of these exports were for protective packaging and commodity food packaging products such as egg cartons and trays. However, as the US increasingly adopts newer dry pulp technology and domestic production expands to include a wider breadth of products, exports are forecast to increase significantly.

- Executive Summary
- Figure 1-1. Molded Fiber Packaging Market
- Short Term Analysis
- Economic Forecast
- Table | Macroeconomic Indicators, 2020 - 2024
- Figure 2-1. Macroeconomic Indicators, 2020 - 2023
- Short Term Molded Fiber Packaging Trends
- Table | Annual Molded Fiber Packaging Demand by Product, 2020 - 2024
- Table | Annual Molded Fiber Packaging Demand by Market, 2020 - 2024
- Figure 2-2. Molded Fiber Packaging Demand, 2020 - 2025
- Economic Forecast
- Overview
- Study Scope
- Figure 3-1. Molded Fiber: Products Examples
- Figure 3-2. Molded Fiber: Products Examples
- Historical Market Trends
- Table | Molded Fiber Packaging Demand, 2012 - 2022
- Figure 3-3. Molded Fiber Packaging Demand, 2006 - 2022
- Molded Fiber Supply & Demand
- Demand Overview
- Table | Molded Fiber Packaging Demand, 2012, 2017, 2022, 2027, &2032
- Table | Annual Molded Fiber Packaging Demand, 2019 - 2026
- Trade Balance
- Table | Molded Fiber Packaging Supply & Demand, 2012, 2017, 2022, 2027, &2032
- Table | Annual Molded Fiber Packaging Supply & Demand, 2019 - 2026
- Figure 3-4. Molded Fiber Packaging Imports by Source, 2022
- Figure 3-5. Molded Fiber Packaging Exports by Destination, 2022
- US Production
- Demand Overview
- Products Overview
- Table | Molded Fiber Demand Packaging by Product, 2012, 2017, 2022, 2027, &2032
- Table | Annual Molded Fiber Demand Packaging by Product, 2019 - 2026
- Figure 3-6. Molded Fiber Packaging Demand by Product, 2012, 2017, 2022, 2027, &2032
- Markets Overview
- Table | Molded Fiber Packaging Demand by Market, 2019 - 2026
- Table | Annual Molded Fiber Packaging Demand by Market, 2019 - 2026
- Figure 3-7. Molded Fiber Packaging Demand by Market, 2012, 2017, 2022, 2027, &2032
- Pricing & Product Mix
- Table | Molded Fiber Packaging Prices by Product, 2012, 2017, 2022, 2027, &2032
- Table | Annual Molded Packaging Fiber Prices by Product, 2019 - 2026
- Global Trends
- Figure 3-8. Global Molded Fiber Packaging Demand by Region, 2022
- Study Scope
- Factors Impacting Molded Fiber Demand
- Foodservice Industry Trends
- Table | Foodservice Revenues by Establishment Type, 2012, 2017, 2022, 2027, &2032
- Figure 4-1. Foodservice Disposable Packaging Share By Material, 2022
- Food & Beverage Production & Packaging Trends
- Table | Food & Beverage Shipments, 2012, 2017, 2022, 2027, &2032
- Figure 4-2. Food Packaging Demand Share By Material, 2022
- Durable Goods Production Trends
- Table | Selected Durable Goods Shipments by Type, 2012, 2017, 2022, 2027, &2032
- Competitive Products Comparison
- Table | Molded Fiber vs. Competitive Materials
- Figure 4-3. Competitive Material Growth Rates, 2022 - 2027
- New Product Development
- Sustainability Initiatives
- Environmental Advantages of Molded Fiber
- Use of Waste Fiber & Recycled Content
- No Tree Movement
- PFAS Concerns & New Coatings Development
- Regulations & Plastic Product Bans
- Production Technology Trends
- Conventional Production Processes
- Types of Molded Fiber Products
- Dry Molded Fiber Technology
- Consumer Attitudes & Preferences
- Consumer Attitudes: Importance of Being Seen as Environmentally Conscious
- Table | "It Is Important For Me To Be Seen As Environmentally Conscious" by Gender & Age Group, 2023
- Consumer Attitudes: Recyclable Packaging
- Table | Consumer Attitudes on Recyclable Packaging by Gender, Age Group, &Desire to Be Seen As Environmental
- Consumer Attitudes: Packaging Reduction
- Table | Consumer Attitudes on Packaging Reduction by Gender, Age Group, &Desire to Be Seen As Environmentall
- Consumer Attitudes: Preference for Paper- or Fiber-Based Packaging
- Table | "I Prefer to Buy Products With Paper Or Paper Fiber-Based Packaging Whenever Possible" by Gender, Ag
- Consumer Attitudes: Packaging Materials Ranked by Perceived Eco-Friendliness
- Table | Consumer Perception of the Eco-Friendliness of Packaging Materials, 2023
- Consumer Attitudes: Importance of Being Seen as Environmentally Conscious
- Foodservice Industry Trends
- Molded Fiber Raw Material Trends
- Materials Overview
- Figure 5-1. Molded Fiber Raw Material Demand Share by Fiber Source, 2012 - 2032
- Figure 5-2. Molded Fiber Raw Material Demand Growth by Fiber Source, 2022 - 2027
- Wood Fiber (Pulp) Products
- Molded Wood Pulp Product Demand
- New Product Development
- Key Suppliers
- Nonwood Fiber Products
- Demand Outlook & Materials Trends
- Figure 5-3. Nonwood Fiber Demand Growth by Fiber Source, 2022 - 2027
- Sugarcane (Bagasse)
- Wheat Straw
- Bamboo Fiber
- Other Fibers (Hemp, Grass)
- Demand Outlook & Materials Trends
- Materials Overview
- Primary & Secondary Packaging
- Scope & Product Description
- Figure 6-1. Primary & Secondary Molded Fiber Packaging: Product Examples,
- Product Overview
- Demand by Product
- Table | Primary & Secondary Molded Fiber Packaging Demand by Product, 2012, 2017, 2022, 2027, &2032
- Table | Annual Primary & Secondary Molded Fiber Packaging Demand by Product, 2019 - 2026
- Figure 6-2. Primary & Secondary Molded Fiber Packaging Demand by Product, 2012, 2017, 2022, 2027, &2
- Cups & Lids
- Table | Molded Fiber Cup & Lid Demand by Product Type & Market, 2012, 2017, 2022, 2027, &2032
- Table | Annual Molded Fiber Cup & Lid Demand by Product Type & Market, 2019 - 2026
- Packaging Trays, Filler Flats, &Bowls
- Table | Molded Fiber Packaging Tray, Flat, &Bowl Demand by Market, 2012, 2017, 2022, 2027, &2032
- Table | Annual Molded Fiber Packaging Tray, Flat, &Bowl Demand by Market, 2019 - 2026
- Egg Cartons
- Table | Molded Fiber Egg Carton Demand, 2012, 2017, 2022, 2027, &2032
- Table | Annual Molded Fiber Egg Carton Demand, 2019 - 2026
- Two-Piece Containers
- Table | Molded Fiber Two-Piece Container Demand by Market, 2012, 2017, 2022, 2027, &2032
- Table | Annual Molded Fiber Two-Piece Container Demand by Market, 2019 - 2026
- Clamshells
- Table | Molded Fiber Clamshell Demand by Market, 2012, 2017, 2022, 2027, &2032
- Table | Annual Molded Fiber Clamshell Demand by Market, 2019 - 2026
- Baskets, Tills, &Punnets
- Table | Molded Fiber Basket, Till, &Punnet Demand by Market, 2012, 2017, 2022, 2027, &2032
- Table | Annual Molded Fiber Basket, Till, &Punnet Demand by Market, 2019 - 2026
- Bottles
- Table | Molded Fiber Bottle Demand by Market, 2012, 2017, 2022, 2027, &2032
- Table | Annual Molded Fiber Bottle Demand by Market, 2019 - 2026
- Set-Up Boxes
- Table | Molded Fiber Set-Up Box Demand by Market, 2012, 2017, 2022, 2027, &2032
- Table | Annual Molded Fiber Set-Up Box Demand by Market, 2019 - 2026
- Other Primary & Secondary Packaging
- Table | Other Molded Fiber Product Demand by Market, 2012, 2017, 2022, 2027, &2032
- Table | Annual Other Molded Fiber Product Demand by Market, 2019 - 2026
- Demand by Product
- Markets
- Table | Primary & Secondary Markets for Molded Fiber Packaging, 2012, 2017, 2022, 2027, &2032
- Table | Annual Primary & Secondary Markets for Molded Fiber Packaging, 2019 - 2026
- Figure 6-3. Primary & Secondary Packaging Markets for Molded Fiber Products, 2012, 2017, 2022, 2027,
- Key Suppliers
- Scope & Product Description
- Serviceware
- Scope & Product Description
- Figure 7-1. Molded Fiber Serviceware: Product Examples
- Product Overview
- Demand by Product
- Table | Molded Fiber Serviceware Demand by Product, 2012, 2017, 2022, 2027, &2032
- Table | Annual Molded Fiber Serviceware Demand by Product, 2019 - 2026
- Figure 7-2. Molded Fiber Serviceware Demand by Product, 2012, 2017, 2022, 2027, &2032
- Cafeteria/Lunch Trays
- Table | Molded Fiber Cafeteria/Lunch Tray Demand by Market, 2012, 2017, 2022, 2027, &2032
- Table | Annual Molded Fiber Cafeteria/Lunch Tray Demand by Market, 2019 - 2026
- Dinnerware (Plates & Bowls)
- Table | Molded Fiber Dinnerware Demand by Market, 2012, 2017, 2022, 2027, &2032
- Table | Annual Molded Fiber Dinnerware Demand by Market, 2019 - 2026
- Food Trays & Boats
- Table | Molded Fiber Food Tray & Boat Demand by Market, 2012, 2017, 2022, 2027, &2032
- Table | Annual Molded Fiber Food Tray & Boat Demand by Market, 2019 - 2026
- Beverage Carriers
- Table | Molded Fiber Beverage Carrier Demand by Market, 2012, 2017, 2022, 2027, &2032
- Table | Annual Molded Fiber Beverage Carrier Demand by Market, 2019 - 2026
- Other Serviceware
- Table | Other Molded Fiber Serviceware Demand by Market, 2012, 2017, 2022, 2027, &2032
- Table | Annual Other Molded Fiber Serviceware Demand by Market, 2019 - 2026
- Demand by Product
- Serviceware Markets
- Table | Molded Fiber Serviceware Demand by Market, 2012, 2017, 2022, 2027, &2032
- Table | Annual Molded Fiber Serviceware Demand by Market, 2019 - 2026
- Key Suppliers
- Scope & Product Description
- Protective Packaging
- Scope & Product Description
- Figure 8-1. Molded Fiber Protective Packaging: Product Examples
- Product Overview
- Demand by Product
- Table | Molded Fiber Protective Packaging Demand by Product, 2012, 2017, 2022, 2027, &2032
- Table | Annual Molded Fiber Protective Packaging Demand by Product, 2019 - 2026
- Figure 8-2. Molded Fiber Protective Packaging Demand by Product, 2012, 2017, 2022, 2027, &2032
- Tray Inserts
- Table | Molded Fiber Tray Insert Demand by Market, 2012, 2017, 2022, 2027, &2032
- Table | Annual Molded Fiber Tray Insert Demand by Market, 2019 - 2026
- End Caps
- Table | Molded Fiber End Cap Demand by Market, 2012, 2017, 2022, 2027, &2032
- Table | Annual Molded Fiber End Cap Demand by Market, 2019 - 2026
- Shippers
- Table | Molded Fiber Shipper Demand by Market, 2012, 2017, 2022, 2027, &2032
- Table | Annual Molded Fiber Shipper Demand by Market, 2019 - 2026
- Pallets
- Table | Molded Fiber Pallet Demand by Market, 2012, 2017, 2022, 2027, &2032
- Table | Annual Molded Fiber Pallet Demand by Market, 2019 - 2026
- Other Products (Cradles, Corner Guards, Cushioning & Void Fill)
- Table | Other Molded Fiber Protective Packaging Product Demand by Product & Market, 2012, 2017, 2022, 2027,
- Table | Annual Other Molded Fiber Protective Packaging Product Demand by Product & Market, 2019 - 2026
- Demand by Product
- Protective Packaging Markets
- Table | Molded Fiber Protective Packaging Demand by Market, 2012, 2017, 2022, 2027, &2032
- Table | Annual Molded Fiber Protective Packaging Demand by Market, 2019 - 2026
- Figure 8-3. Molded Fiber Protective Packaging Demand by Market, 2012, 2017, 2022, 2027, &2032
- Key Suppliers
- Scope & Product Description
- Non-Packaging Molded Fiber Products
- Scope & Product Description
- Figure 9-1. Other Molded Fiber Products: Product Examples
- Product Overview
- Demand by Product
- Table | Other Molded Fiber Product Demand by Product, 2012, 2017, 2022, 2027, &2032
- Table | Annual Other Molded Fiber Product Demand by Product, 2019 - 2026
- Consumer Tableware
- Floral & Nursery Pots
- Medical Bedpans, Bottles, &Basins
- All Other Products
- Demand by Product
- Markets
- Table | Other Molded Fiber Product Demand by Market, 2012, 2017, 2022, 2027, &2032
- Table | Annual Other Molded Fiber Product Demand by Market, 2019 - 2026
- Scope & Product Description
- Foodservice Market
- Market Scope
- Figure 10-1. Foodservice Molded Fiber: Product Examples
- Foodservice Molded Fiber Products
- Table | Foodservice Molded Fiber Product Demand by Product, 2012, 2017, 2022, 2027, &2032
- Table | Annual Foodservice Molded Fiber Product Demand by Product, 2019 - 2026
- Figure 10-2. Foodservice Molded Fiber Product Demand by Product, 2012, 2017, 2022, 2027, &2032
- Foodservice Markets
- Demand by Market
- Table | Foodservice Molded Fiber Product Demand by Market, 2012, 2017, 2022, 2027, &2032
- Table | Annual Foodservice Molded Fiber Product Demand by Market, 2019 - 2026
- Figure 10-3. Foodservice Molded Fiber Product Demand by Market, 2012, 2017, 2022, 2027, &2032
- Limited-Service Restaurants
- Table | Limited-Service Restaurant Demand for Molded Fiber by Product, 2012, 2017, 2022, 2027, &2032
- Table | Annual Limited-Service Restaurant Demand for Molded Fiber by Product, 2019 - 2026
- Full-Service Restaurants
- Table | Full Service Restaurant Demand for Molded Fiber by Product, 2012, 2017, 2022, 2027, &2032
- Table | Annual Full Service Restaurant Demand for Molded Fiber by Product, 2019 - 2026
- Institutional
- Table | Institutional Foodservice Demand for Molded Fiber by Product, 2012, 2017, 2022, 2027, &2032
- Table | Annual Institutional Foodservice Demand for Molded Fiber by Product, 2019 - 2026
- Other Noncommercial Foodservice
- Table | Other Noncommercial Foodservice Molded Fiber Demand by Product, 2012, 2017, 2022, 2027, &2032
- Table | Annual Other Noncommercial Foodservice Molded Fiber Demand by Product, 2019 - 2026
- Demand by Market
- New Product Development
- Market Scope
- Food & Beverage Packaging Market
- Market Scope
- Figure 11-1. Food & Beverage Molded Fiber Packaging: Product Examples
- Food & Beverage Molded Fiber Products
- Table | Food & Beverage Molded Fiber Packaging Demand by Product, 2012, 2017, 2022, 2027, &2032
- Table | Annual Food & Beverage Molded Fiber Packaging Demand by Product, 2019 - 2026
- Figure 11-2. Food & Beverage Molded Fiber Packaging Demand by Product, 2012, 2017, 2022, 2027, &2032
- Food & Beverage Packaging Applications
- Demand by Application
- Table | Food & Beverage Molded Fiber Packaging Demand by Application, 2012, 2017, 2022, 2027, &2032
- Table | Annual Food & Beverage Molded Fiber Packaging Demand by Application, 2019 - 2026
- Figure 11-3. Food & Beverage Molded Fiber Packaging Demand by Application, 2012, 2017, 2022, 2027, &
- Eggs
- Table | Molded Fiber Egg Packaging Demand by Product, 2012, 2017, 2022, 2027, &2032
- Table | Annual Molded Fiber Egg Packaging Demand by Product, 2019 - 2026
- Fresh Produce
- Table | Molded Fiber Fresh Produce Packaging Demand by Product, 2012, 2017, 2022, 2027, &2032
- Table | Annual Molded Fiber Fresh Produce Packaging Demand by Product, 2019 - 2026
- Wine & Other Beverages
- Table | Molded Fiber Wine & Other Beverage Packaging Demand by Product, 2012, 2017, 2022, 2027, &2032
- Table | Annual Molded Fiber Wine & Other Beverage Packaging Demand by Product, 2019 - 2026
- Other Food Packaging
- Table | Molded Fiber Packaging Demand for Other Foods by Product, 2012, 2017, 2022, 2027, &2032
- Table | Annual Molded Fiber Packaging Demand for Other Foods by Product, 2019 - 2026
- Demand by Application
- New Product Development
- Market Scope
- Nonfood Packaging Markets
- Market Scope
- Figure 12-1. Nonfood Molded Fiber Packaging: Product Examples
- Nonfood Molded Fiber Packaging Products
- Table | Molded Fiber Nonfood Packaging Demand by Product, 2012, 2017, 2022, 2027, &2032
- Table | Annual Molded Fiber Nonfood Packaging Demand by Product, 2019 - 2026
- Figure 12-2. Molded Fiber Nonfood Packaging Demand by Product, 2012, 2017, 2022, 2027, &2032
- Nonfood Packaging Markets
- Demand by Application
- Table | Molded Fiber Nonfood Packaging Demand by Application, 2012, 2017, 2022, 2027, &2032
- Table | Annual Molded Fiber Nonfood Packaging Demand by Application, 2019 - 2026
- Figure 12-3. Molded Fiber Nonfood Packaging Demand by Market, 2012, 2017, 2022, 2027, &2032
- Automotive Parts
- Table | Molded Fiber Automotive Part Packaging Demand by Product, 2012, 2017, 2022, 2027, &2032
- Table | Annual Molded Fiber Automotive Part Packaging Demand by Product, 2019 - 2026
- Industrial Components
- Table | Molded Fiber Industrial Component Packaging Demand by Product, 2012, 2017, 2022, 2027, &2032
- Table | Annual Molded Fiber Industrial Component Packaging Demand by Product, 2019 - 2026
- Appliances & Home Goods
- Table | Molded Fiber Appliance & Home Goods Packaging Demand by Product, 2012, 2017, 2022, 2027, &2032
- Table | Annual Molded Fiber Appliance & Home Goods Packaging Demand by Product, 2019 - 2026
- Electronics
- Table | Molded Fiber Electronics Packaging Demand by Product, 2012, 2017, 2022, 2027, &2032
- Table | Annual Molded Fiber Electronics Packaging Demand by Product, 2019 - 2026
- Personal Care & Cleaning Products
- Table | Molded Fiber Personal Care & Cleaning Product Packaging Demand by Product, 2012, 2017, 2022, 2027, &
- Table | Annual Molded Fiber Personal Care & Cleaning Product Packaging Demand by Product, 2019 - 2026
- Other Nonfood Packaging Applications
- Table | Molded Fiber Packaging Demand for Other Nonfood Markets by Product, 2012, 2017, 2022, 2027, &2032
- Table | Annual Molded Fiber Packaging Demand for Other Nonfood Markets by Product, 2019 - 2026
- Demand by Application
- New Product Development
- Market Scope
- Retail Sales & Other Markets
- Market Scope
- Figure 13-1. Other Markets Molded Fiber: Product Examples
- Demand by Product
- Table | Retail & Other Markets Demand for Molded Fiber by Product, 2012, 2017, 2022, 2027, &2032
- Table | Annual Retail & Other Markets Demand for Molded Fiber by Product, 2019 - 2026
- Figure 13-2. Retail & Other Markets Demand for Molded Fiber by Product, 2012, 2017, 2022, 2027, &203
- Other Markets Overview
- Demand by Market
- Table | Retail & Other Demand for Molded Fiber by Market, 2012, 2017, 2022, 2027, &2032
- Table | Annual Retail & Other Demand for Molded Fiber by Market, 2019 - 2026
- Figure 13-3. Retail & Other Demand for Molded Fiber by Market, 2012, 2017, 2022, 2027, &2032
- Retail Sales (Consumer Market)
- Table | Retail/Consumer Demand for Molded Fiber by Product, 2012, 2017, 2022, 2027, &2032
- Table | Annual Retail/Consumer Demand for Molded Fiber by Product, 2019 - 2026
- E-Commerce Shipping
- Table | E-Commerce Demand for Molded Fiber by Product, 2012, 2017, 2022, 2027, &2032
- Table | Annual E-Commerce Demand for Molded Fiber by Product, 2019 - 2026
- Horticultural & Agricultural Products
- Table | Horticultural & Agricultural Product Demand for Molded Fiber, 2012, 2017, 2022, 2027, &2032
- Table | Annual Horticultural & Agricultural Product Demand for Molded Fiber, 2019 - 2026
- Medical Products
- Table | Medical Product Demand for Molded Fiber, 2012, 2017, 2022, 2027, &2032
- Table | Annual Medical Product Demand for Molded Fiber, 2019 - 2026
- Apparel & Other Products
- Table | Apparel & Other Product Demand for Molded Fiber, 2012, 2017, 2022, 2027, &2032
- Table | Annual Apparel & Other Product Demand for Molded Fiber, 2019 - 2026
- Demand by Market
- Market Scope
- Industry Structure
- Key Findings & Industry Composition
- Table | US Molded Fiber Sales by Company, 2022
- Market Share
- Figure 14-1. US Molded Fiber Market Share by Company, 2022
- Figure 14-2. US Molded Fiber Market: Leading Supplier, 2022
- Figure 14-3. US Molded Fiber Market: Second Leading Supplier, 2022
- Figure 14-4. US Molded Fiber Market: Third Leading Supplier, 2022
- Figure 14-5. US Molded Fiber Market: Fourth Leading Supplier, 2022
- Figure 14-6. US Molded Fiber Market: Fifth Leading Supplier, 2022
- Figure 14-7. US Molded Fiber Market: Sixth Leading Supplier, 2022
- Mergers & Acquisitions
- Table | Selected Mergers & Acquisitions
- List of Industry Participants
- Table | Selected Industry Participants
- Key Findings & Industry Composition
- Appendix
- Report Details
- Table | Relevant Industry Codes
- Table | Relevant HS Codes
- Definitions
- Abbreviations
- Table | Abbreviations & Acronyms Used in Study
- Freedonia Methodology
- Study-Specific Methodology
- Data Changes from Previous Version
- Sources
- Associations & Agencies
- Related Studies & Reports
- Macroeconomic Assumptions
- Economic Environment
- Table | Macroeconomic Indicators, 2012, 2017, 2022, 2027, &2032
- Demographic Trends
- Table | Population & Households, 2012, 2017, 2022, 2027, &2032
- Manufacturers' Shipments
- Table | Manufacturers' Shipments, 2012, 2017, 2022, &2027
- Retail Sales
- Table | Nondurable Goods Retail Sales, 2012, 2017, 2022, &2027
- Table | Durable Goods Retail Sales, 2012, 2017, 2022, &2027
- E-Commerce Sales
- Table | E-Commerce Sales, 2012, 2017, 2022, &2027
- Economic Environment
- Report Details
At the highest level, demand for molded fiber packaging is driven by trends in its primary markets – foodservice and food, and increasingly retail and nonfood – which is an indicator of the number of potential packaging applications.
Molded fiber packaging is defined as rigid packaging formed from fibrous materials using wet or dry processes. Sources of fibers include wood (including virgin fibers and recycled paper and paperboard), fast growing plants like bamboo, and food processing or agricultural waste such as bagasse or wheat straw.
US demand for molded fiber packaging is forecast to increase 7.8% per year to $3.0 billion in 2027, with real growth of 8.2% to 24.6 billion units.
The top six suppliers of molded pulp packaging to the US include Huhtamaki, Pactiv Evergreen, Brødrene Hartmann (which does business as Hartmann), Tekni-Plex, Genpak, and Footprint.