US Plastic & Composite Fencing
This Freedonia industry study analyzes the $1.2 billion US market for plastic and composite fencing. It presents historical demand data (2012, 2017, and 2022) and forecasts (2027 and 2032) as well as annual data for years 2019-2026. Unit demand and value demand data is shown for Fencing by material, product type and market.
Free Sample Report
Request a free sample of this report and our team will email it to you.
Report Overview
Featuring 42 tables and 18 figures – available in Excel and Powerpoint! Learn More
This Freedonia industry study analyzes the $1.2 billion US market for plastic and composite fencing. It presents historical demand data (2012, 2017, and 2022) and  forecasts (2027 and 2032) as well as annual data for years 2019-2026. Unit demand and value demand data is shown for Fencing by material (plastic, composite), product type (vinyl fencing, hdpe fencing, polypropylene fencing) and market (new, improvement, and repair demand in both residential and commercial applications).
Durability & Aesthetics Allow Plastic to Gain Market Share at Wood’s Expense
Plastic fencing (primarily vinyl) has increased in popularity in the residential market as it is recognized as a more durable and lower maintenance alternative to wood. Plastic fencing’s share of the market will continue to rise as its aesthetics improve, with new vinyl fencing designs and colors that more closely resemble wood. In addition, a greater variety of vinyl fencing products at a wider range of price points will become available as suppliers invest more in this burgeoning fencing material.
Sustainability, Performance & Greater Availability Bolster Demand for Composite Fencing
Although it will continue to account for a small share of demand, sales of composite fencing will rise, boosted by:
-
its sustainability image, as composite fencing does not rely on virgin wood, can incorporate recycled materials into its production, and is perceived as being more environmentally friendly than plastic fencing
-
more consumer awareness of better performing composite products, including capstock-coated composite lumber, which resists decay and mold growth
Demand will also be supported by the greater availability of these products from a wider variety of sources. Many of the companies who offer composite fencing are primarily decking companies, as the production of composite decking boards can also be tailored to make composite fencing. Companies are expected to sell more of their composite boards as fencing, and other decking companies will be able to enter the composite market with relative ease.
Historical Market Trends
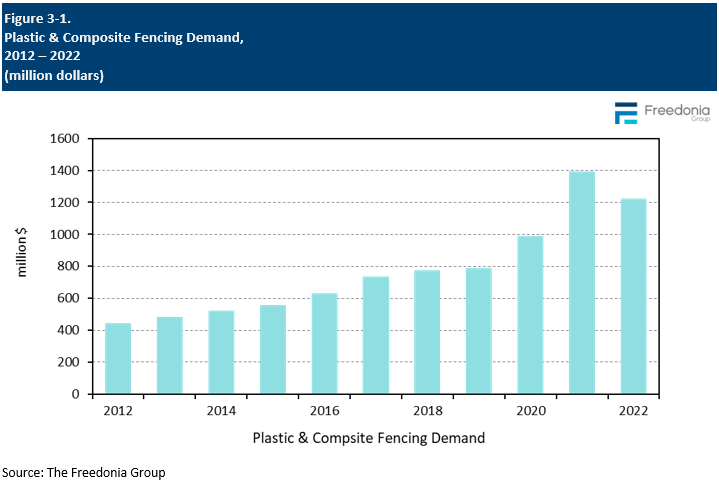
Demand for plastic and composite fencing can vary considerably from year to year, determined by several factors primarily related to trends in construction spending and new home sales. Specific factors impacting annual fencing demand include:- the size and age of the US housing stock
- trends in average property size
- levels of housing starts, particularly in the single-family housing segment, and existing home sales
- the number and types of commercial buildings erected or repaired in any given year
- levels of home renovation activity
- interest rates – low interest rates may encourage home and business owners to take out lines of credit to fund new fence installations or repairs
- weather conditions, especially outbreaks of severe weather – such as hurricanes and tropical storms, tornadoes, and winter storms – that can cause widespread damage to fences
- changes and modifications to state and local building codes
- changes in the price of raw materials (e.g., plastic) that can cause the per-square cost of fencing materials to increase or decrease sharply
- consumer preferences for stay-at-home activities such as gardening, swimming, or outside entertaining, which may require fencing for security or privacy
Markets Overview
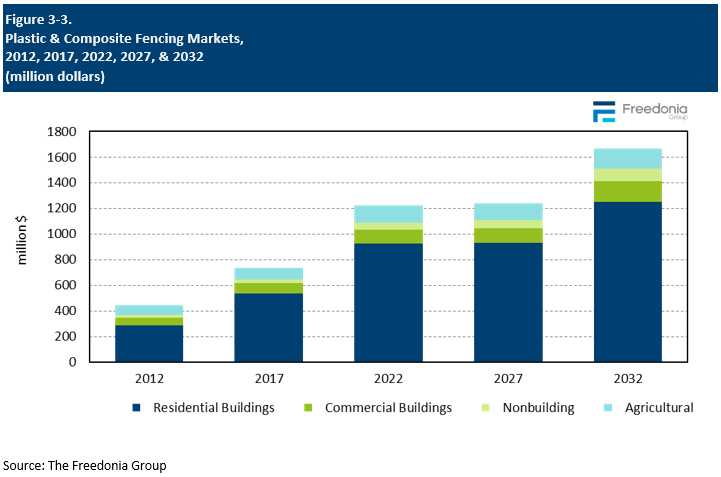
Plastic and composite fencing is most commonly used in the residential market, which accounted for 76% of total plastic and composite fencing demand in 2022. Plastic and composite materials are preferred in this market due to:- their similarities to the appearance of natural wood fencing, which is most used in residential applications
- homeowners being less price-focused than commercial users, making them more willing to buy plastic and composite fencing products despite a higher initial cost due to the fencing’s low maintenance and durability
Plastic and composite fencing is used less commonly in other markets because its lack of strength compared to metal makes it ill-suited for security fencing, especially in the nonbuilding market. However, its durability and minimal maintenance requirements will lead to its use in such commercial applications as hotels, restaurants, and resorts, where a residential feel is desired. In the agricultural market, HDPE fencing is used as a wood fencing replacement for corrals and other containment areas.
Pricing & Installation Costs
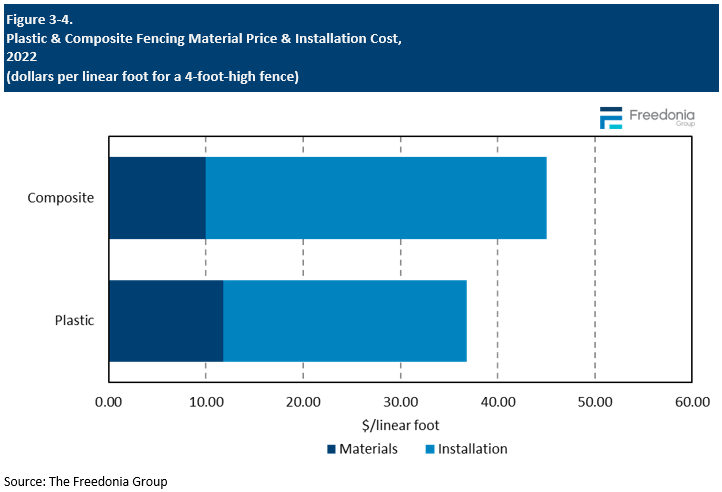
Price changes for fencing products are generally driven by fluctuations in the cost of underlying raw materials such as lumber and plastic resin. The average price of fencing can also depend on trends in the product mix. However, pricing in 2020 to 2022 was significantly altered by the COVID-19 pandemic, which created a variety of shortages – most notably of lumber – and supply chain issues, causing prices to spike in 2021 and 2022. As many of these issues have been resolved, prices are expected moderate significantly through 2027.Manufacturers’ prices alone can be somewhat misleading when gauging the final installed cost of fencing from a buyer’s perspective, since installation costs can vary widely among materials. For instance, while the initial material cost for plastic fencing is less than that for high-end wood privacy fencing, it is more difficult and time-consuming to install, resulting in a higher final installed cost.
The installation costs of a particular fence depend on such factors as:
- fencing material used
- design, style, and shape of the fence
- ease of cutting and assembling the fencing
- number of gates
- use of automatic operators for the gates
Material Trends
Demand by Material
Buildings included in this segment are used for such purposes as manufacturing, offices, retail or wholesale trade, public safety, healthcare, education, or public assembly. as prices moderate significantly from high levels in 2021 and 2022 that resulted from supply chain issues and rising raw material costs. However, volume demand is expected to grow as vinyl fencing gains share in the residential market, where its durability and low maintenance requirements make it an attractive alternative to wood for homeowners.
Other plastics such as HDPE and polypropylene will also see increased demand but will remain niche products for the most part due to its cost and application.
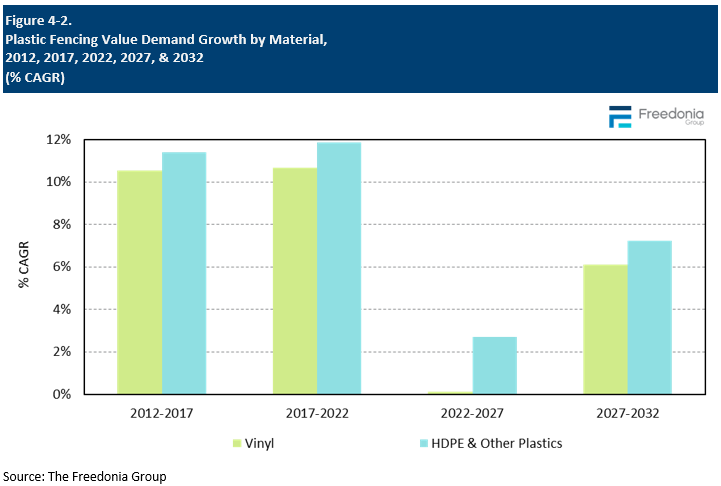
The US plastic and composite fencing market is forecast to grow minimally to $1.2 billion in 2027, a significant deceleration from the 2017-2022 period, when market value was boosted by a surge in fencing prices in 2021 and 2022 that resulted from a combination of supply chain issues and rising raw material costs. In real terms, demand is expected to grow 1.9% per year, driven by homeowners increasingly opting for vinyl over wood when installing or replacing their fencing.
Durability & Aesthetics Allow Plastic to Gain Market Share at Wood’s Expense
Plastic fencing (primarily vinyl) has increased in popularity in the residential market as it is recognized as a more durable and lower maintenance alternative to wood. Plastic fencing’s share of the market will continue to rise as its aesthetics improve, with new vinyl fencing designs and colors that more closely resemble wood. In addition, a greater variety of vinyl fencing products at a wider range of price points will become available as suppliers invest more in this burgeoning fencing material.
Sustainability, Performance & Greater Availability Bolster Demand for Composite Fencing
Although it will continue to account for a small share of demand, sales of composite fencing will rise, boosted by:
-
its sustainability image, as composite fencing does not rely on virgin wood, can incorporate recycled materials into its production, and is perceived as being more environmentally friendly than plastic fencing
-
more consumer awareness of better performing composite products, including capstock-coated composite lumber, which resists decay and mold growth
Demand will also be supported by the greater availability of these products from a wider variety of sources. Many of the companies who offer composite fencing are primarily decking companies, as the production of composite decking boards can also be tailored to make composite fencing. Companies are expected to sell more of their composite boards as fencing, and other decking companies will be able to enter the composite market with relative ease.
Historical Market Trends
Demand for plastic and composite fencing can vary considerably from year to year, determined by several factors primarily related to trends in construction spending and new home sales. Specific factors impacting annual fencing demand include:- the size and age of the US housing stock
- trends in average property size
- levels of housing starts, particularly in the single-family housing segment, and existing home sales
- the number and types of commercial buildings erected or repaired in any given year
- levels of home renovation activity
- interest rates – low interest rates may encourage home and business owners to take out lines of credit to fund new fence installations or repairs
- weather conditions, especially outbreaks of severe weather – such as hurricanes and tropical storms, tornadoes, and winter storms – that can cause widespread damage to fences
- changes and modifications to state and local building codes
- changes in the price of raw materials (e.g., plastic) that can cause the per-square cost of fencing materials to increase or decrease sharply
- consumer preferences for stay-at-home activities such as gardening, swimming, or outside entertaining, which may require fencing for security or privacy

Markets Overview
Plastic and composite fencing is most commonly used in the residential market, which accounted for 76% of total plastic and composite fencing demand in 2022. Plastic and composite materials are preferred in this market due to:- their similarities to the appearance of natural wood fencing, which is most used in residential applications
- homeowners being less price-focused than commercial users, making them more willing to buy plastic and composite fencing products despite a higher initial cost due to the fencing’s low maintenance and durability
Plastic and composite fencing is used less commonly in other markets because its lack of strength compared to metal makes it ill-suited for security fencing, especially in the nonbuilding market. However, its durability and minimal maintenance requirements will lead to its use in such commercial applications as hotels, restaurants, and resorts, where a residential feel is desired. In the agricultural market, HDPE fencing is used as a wood fencing replacement for corrals and other containment areas.

Pricing & Installation Costs
Price changes for fencing products are generally driven by fluctuations in the cost of underlying raw materials such as lumber and plastic resin. The average price of fencing can also depend on trends in the product mix. However, pricing in 2020 to 2022 was significantly altered by the COVID-19 pandemic, which created a variety of shortages – most notably of lumber – and supply chain issues, causing prices to spike in 2021 and 2022. As many of these issues have been resolved, prices are expected moderate significantly through 2027.Manufacturers’ prices alone can be somewhat misleading when gauging the final installed cost of fencing from a buyer’s perspective, since installation costs can vary widely among materials. For instance, while the initial material cost for plastic fencing is less than that for high-end wood privacy fencing, it is more difficult and time-consuming to install, resulting in a higher final installed cost.
The installation costs of a particular fence depend on such factors as:
- fencing material used
- design, style, and shape of the fence
- ease of cutting and assembling the fencing
- number of gates
- use of automatic operators for the gates

Material Trends
Demand by Material
Buildings included in this segment are used for such purposes as manufacturing, offices, retail or wholesale trade, public safety, healthcare, education, or public assembly. as prices moderate significantly from high levels in 2021 and 2022 that resulted from supply chain issues and rising raw material costs. However, volume demand is expected to grow as vinyl fencing gains share in the residential market, where its durability and low maintenance requirements make it an attractive alternative to wood for homeowners.
Other plastics such as HDPE and polypropylene will also see increased demand but will remain niche products for the most part due to its cost and application.

- Executive Summary
- Figure 1-1. Plastic & Composite Fencing Market Outlook
- About This Report
- Report Details
- Market Scope & Product Description
- Short-Term Plastic & Composite Fencing Market Trends
- Table | Plastic & Composite Fencing Demand by Material, 2020 - 2024
- Figure 2-1. Plastic & Composite Fencing Demand, 2020 - 2024
- Overview
- Historical Market Trends
- Table | Plastic & Composite Fencing Demand, 2012 - 2022
- Figure 3-1. Plastic & Composite Fencing Demand, 2012 - 2022
- Product Overview (Linear Feet & Value)
- Table | Plastic & Composite Fencing Demand by Product Type, 2012, 2017, 2022, 2027, &2032
- Table | Annual Plastic & Composite Fencing Demand by Product Type, 2019 - 2026
- Figure 3-2. Plastic & Composite Fencing Demand by Product Type, 2012, 2017, 2022, 2027, &2032
- Markets Overview
- Table | Plastic & Composite Fencing Demand by Market, 2012, 2017, 2022, 2027, &2032
- Table | Annual Plastic & Composite Fencing Demand by Market, 2019 - 2026
- Figure 3-3. Plastic & Composite Fencing Markets, 2012, 2017, 2022, 2027, &2032
- Pricing & Installation Costs
- Figure 3-4. Plastic & Composite Fencing Material Price & Installation Cost, 2022
- Factors Impacting Demand
- Building Codes
- Sustainability
- Historical Market Trends
- Plastic Fencing
- Scope & Product Description
- Demand Forecast (Value & Linear Feet)
- Table | Plastic Fencing Demand, 2012, 2017, 2022, 2027, &2032
- Table | Annual Plastic Fencing Demand, 2019 - 2026
- Pricing Trends
- Figure 4-1. Average Price of Plastic Fencing, 2012, 2017, 2022, 2027, &2032
- Installation Costs
- Table | Installed Plastic Fencing Demand & Installation Costs, 2012, 2017, 2022, 2027, &2032
- Material Trends
- Demand by Material
- Table | Plastic Fencing Demand by Material, 2012, 2017, 2022, 2027, &2032
- Table | Annual Plastic Fencing Demand by Material, 2019 - 2026
- Figure 4-2. Plastic Fencing Value Demand Growth by Material, 2012, 2017, 2022, 2027, &2032
- Vinyl Fencing
- Figure 4-3. Vinyl Fencing Demand, 2012, 2017, 2022, 2027, &2032
- Figure 4-4. Vinyl Fencing: Advantages & Disadvantages
- Other Plastic Fencing (HDPE & Polypropylene)
- Figure 4-5. HDPE & Other Plastic Fencing Demand, 2012, 2017, 2022, 2027, &2032
- Figure 4-6. HDPE & Other Plastic Fencing: Advantages & Disadvantages
- Demand by Material
- Market Trends
- Demand by Market
- Table | Plastic Fencing Demand by Market, 2012, 2017, 2022, 2027, &2032
- Table | Annual Plastic Fencing Demand by Market, 2019 - 2026
- Residential Buildings
- Table | Residential Plastic Fencing Demand by Application & Housing Type, 2012, 2017, 2022, 2027, &2032
- Table | Annual Residential Plastic Fencing Demand by Application & Housing Type, 2019 - 2026
- Commercial Buildings
- Table | Commercial Plastic Fencing Demand by Application & Building Type, 2012, 2017, 2022, 2027, &2032
- Table | Annual Commercial Plastic Fencing Demand by Application & Building Type, 2019 - 2026
- Nonbuilding
- Table | Nonbuilding Plastic Fencing Demand by Application, 2012, 2017, 2022, 2027, &2032
- Table | Annual Nonbuilding Plastic Fencing Demand by Application, 2019 - 2026
- Agricultural
- Table | Agricultural Plastic Fencing Demand by Application, 2012, 2017, 2022, 2027, &2032
- Table | Annual Agricultural Plastic Fencing Demand by Application, 2019 - 2026
- Demand by Market
- Key Suppliers & Market Share
- Figure 4-7. Plastic Fencing Market Share by Company, 2022
- Composite Fencing
- Scope & Product Description
- Figure 5-1. Composite Fencing: Advantages & Disadvantages
- Demand Forecast (Value & Linear Feet)
- Table | Composite Fencing Demand, 2012, 2017, 2022, 2027, &2032
- Table | Annual Composite Fencing Demand, 2019 - 2026
- Pricing Trends
- Figure 5-2. Average Price of Composite Fencing, 2012, 2017, 2022, 2027, &2032
- Installation Costs
- Table | Installed Composite Fencing Demand & Installation Costs, 2012, 2017, 2022, 2027, &2032
- Market Trends
- Demand by Market
- Table | Composite Fencing Demand by Market, 2012, 2017, 2022, 2027, &2032
- Residential Buildings
- Table | Residential Composite Fencing Demand by Application & Housing Type, 2012, 2017, 2022, 2027, &2032
- Commercial Buildings & Nonbuilding
- Table | Commercial & Nonbuilding Composite Fencing Demand by Application, 2012, 2017, 2022, 2027, &2032
- Demand by Market
- Key Suppliers & Market Share
- Figure 5-3. Composite Fencing Market Share by Company, 2022
- Scope & Product Description
- Key Suppliers & Industry Structure
- Industry Composition
- Market Share
- Figure 6-1. Plastic & Composite Fencing Market Share by Company, 2022
- Mergers & Acquisitions
- Table | Selected Mergers & Acquisitions
- Appendix
- Scope
- Table | Relevant Industry Codes
- Definitions
- Freedonia Methodology
- Study-Specific Methodology
- Sources
- Associations & Agencies
- Related Studies & Reports
- Macroeconomic Assumptions
- Economic Environment
- Table | Macroeconomic Indicators, 2012, 2017, 2022, 2027, &2032
- Demographic Trends
- Table | Population & Households, 2012, 2017, 2022, 2027, &2032
- Consumer Financing
- Table | Consumer Financing Environment, 2012 - 2022
- Consumer Spending
- Table | Personal Consumption Expenditures, 2012, 2017, 2022, 2027, &2032
- Building Construction
- Table | Building Construction Expenditures, 2012, 2017, 2022, 2027, &2032
- Residential Building Construction
- Table | Residential Building Construction Expenditures, 2012, 2017, 2022, 2027, &2032
- Residential Improvement & Repairs
- Table | Residential Improvement & Repair Expenditures, 2012, 2017, 2022, 2027, &2032
- Commercial Building Construction
- Table | Commercial Building Construction Expenditures, 2012, 2017, 2022, 2027, &2032
- Commercial Improvement & Repairs
- Table | Commercial Building Improvement & Repair Expenditures, 2012, 2017, 2022, 2027, &2032
- Nonbuilding Construction
- Table | Nonbuilding Construction Expenditures, 2012, 2017, 2022, 2027, &2032
- Housing Stock
- Table | Housing Stock by Type, 2012, 2017, 2022, 2027, &2032
- Figure 7-1. Housing Stock: Share by Year of Construction, 2022
- Agricultural Outlook
- Table | Agricultural Indicators, 2012, 2017, 2022, 2027, &2032
- Regional Population
- Table | Population by Region, 2012, 2017, 2022, 2027, &2032
- Economic Environment
- Scope
A fence (or fencing) is defined as a structure that is built around the perimeter of a property or area to mark the boundaries and provide security and/or privacy. Fences can be made from a variety of materials such as wood, metal, plastic, or masonry, and can vary in height, style, and design based on the needs and preferences of the property owner.
Trex is by far the largest supplier of composite fencing, accounting for 68% of sales in 2022.
Price changes for fencing products are generally driven by fluctuations in the cost of underlying raw materials such as lumber and plastic resin. The average price of fencing can also depend on trends in the product mix.
Demand for plastic and composite fencing is forecast to grow slightly to $1.2 billion in 2027 as prices moderate significantly from high levels in 2021 and 2022 that resulted from supply chain issues and rising raw material costs.