US Vinyl Windows & Doors
This report covers the $7.3 billion US vinyl windows & doors industry, including historical market trends, supply and demand, pricing trends, competitive products, and key suppliers. The report provides historical data for the years 2013, 2018, and 2023, and offers forecasts for 2028 and 2033.
Free Sample Report
Request a free sample of this report and our team will email it to you.
Report Overview
Vinyl Windows & Doors Benefit From Energy Efficiency, Low Maintenance, and an Increasing Variety of Style Options
Key Themes Covered in this Study- Differentiable characteristics of vinyl versions compared to other windows and doors
- Innovations in areas such as finishes, colors, and durability
- Trends in low maintenance and climate resilience building design
Featuring 57 tables and 24 figures!
Demand for vinyl windows and doors totaled $7.3 billion in 2023 and is forecast to rise 2.7% per year to $8.4 billion in 2028. In real terms, demand will grow 1.8% per year to 52.3 million units in 2028. Going forward, unit growth will be supported by rising residential building construction and a large stock of older windows in need of replacement with more energy-efficient products, such as vinyl windows. Market value increases will mostly result from unit gains as price growth moderates following the surges that occurred during the latter part of the 2018-2023 period.
Vinyl Windows & Doors: Enhancing Home Energy Efficiency
As building codes and energy standards continue to evolve, the demand for windows and doors featuring strong thermal insulation is accelerating. Vinyl products are preferred for their good energy efficiency, significantly reducing heating and cooling expenses for homeowners. With utility costs rising steadily, homeowners and builders are actively seeking products that can deliver substantial long-term savings. Government incentives, including ENERGY STAR certifications and rebates, provide additional motivation, steering both consumers and industry professionals toward energy-efficient vinyl.
Vinyl Windows: Durable, Stylish, & Built for the Future
Vinyl windows dominate the market due to competitive pricing, low maintenance, and superior insulation. Innovations in vinyl manufacturing have greatly enhanced product durability, improving resistance to UV damage, color fading, and harsh weather conditions, thereby extending product lifespan. Manufacturers have also expanded their product lines with numerous design options, colors, finishes, and textures. Modern vinyl windows closely mimic traditional materials like wood and metal, appealing to homeowners seeking sophisticated aesthetics and practical functionality. Consumers favor vinyl for its blend of strength, performance, and versatile style choices.
Vinyl Windows: Combining Protection & Efficiency for Extreme Conditions
Vinyl is a popular choice for impact-resistant windows, particularly in areas prone to extreme weather like Florida and Texas. Its durability makes it ideal for protecting homes from high winds, flying debris, and severe storms. Vinyl also resists moisture, rot, and corrosion, requiring minimal maintenance. Additionally, it improves energy efficiency by insulating against heat loss and drafts, making it a good, low-maintenance option for resilient homes in storm-prone areas.
Historical Market Trends & Growth Factors
Sales of vinyl windows and doors are impacted significantly by general economic trends and the boom-and-bust nature of the US construction industry. Due to its cyclicality, spending on new building construction – and associated vinyl windows and doors – is typically more volatile than that in the replacement market.
Key factors impacting demand in the new construction market include:
-
trends in single-family construction activity, particularly in the replacement market
-
multifamily remodeling activity and the construction of new high-rises
-
commercial building construction
Prospects in the vinyl window and door renovation market are impacted by a number of factors, including:
-
the current lending environment including interest rates and credit requirements
-
home values, which impact homeowner ability to get home equity loans to fund improvement projects
-
changing consumer preferences regarding style or material
Other factors that impact window and door demand on a year-to-year basis include:
-
government regulations and tax incentive programs such as the Inflation Reduction Act, which grants tax credits to homeowners who replace older windows and doors with energy efficient products
-
outbreaks of severe weather, as heavy storms often damage windows and doors, boosting replacement sales
Demand by Material (PVC vs. WPC)
Vinyl windows and doors primarily consist of two types:
-
PVC windows and doors:
-
made entirely from extruded or molded vinyl (PVC) resins
-
dominates demand due to favorable performance attributes
-
-
WPC (Wood-Plastic Composite) windows and doors:
-
made from vinyl resins blended with reclaimed wood materials like wood chips or sawdust
-
demand driven by consumer preference for natural wood aesthetics and eco-friendly perception due to reclaimed materials
-
PVC products overwhelmingly lead in market share, but WPC products are experiencing healthy growth, encouraged by increased consumer interest, improved extrusion technology, and expanding availability of WPC profiles and components. Traditionally, WPC products (such as Andersen’s Fibrex windows) were only fully assembled at manufacturing sites. Now, innovations allow smaller US companies to import WPC profiles (often internationally sourced) and assemble them domestically, positioning these as premium alternatives.
For doors specifically, PVC dominates demand and is expected to maintain its majority. However, WPC doors, primarily patio and storm doors, are showing above-average growth due to appealing wood-like aesthetics and strong resistance to environmental factors and impacts. Growth is constrained by high costs and limited product availability. Imports remain minimal due to shipping expenses and limited market penetration.
Andersen is a significant player in WPC doors, using its Fibrex material composed of reclaimed wood fibers.
US Vinyl Windows & Doors Report Details
| Current Total Market Size | $7.3 billion |
| Forecast Total Market Growth Rate | 2.7% CAGR from 2023-2028 |
| Historical Period | 2013-2023 |
| Forecast Period | 2023-2033 |
| Units Covered | Million US dollars, million units, $/unit |
| Regions | Northeast, Midwest, South, West |
| Products | Double-hung vinyl windows, single-hung vinyl windows, casement vinyl windows, horizontal sliding vinyl windows, vinyl storm windows, stationary vinyl windows, other vinyl windows, vinyl patio doors, vinyl storm doors, vinyl interior doors, other vinyl exterior doors |
| Markets (Building Types) | Residential (single-family, multifamily, manufactured housing), commercial (office, retail, & lodging; institutional, industrial, other commercial buildings) |
| Applications | New, replacement |
| Point Where Data is Measured | Manufacturer’s level, ex factory |
| Additional Elements | Near Term Trend Analysis, Demand by Material, Pricing Trends & Inflation, Construction Industry Outlook, Average Home Size, Building Codes, Industry Standards, Green Building Certification Programs, Style Trends & Curb Appeal, Performance & Efficiency Trends |
US Vinyl Windows & Doors Industry Participants
| Andersen | MITER Brands |
| Anlin Windows & Doors | MI Windows & Doors |
| Associated Materials | NT Window |
| Cornerstone Building Brands | Pella |
| Earthwise Windows & Doors | ProVia |
| JELD-WEN |
US Vinyl Windows & Doors Report Scope
This study examines the US market for vinyl windows and doors (also known as fenestration products) by product, market, and geographic region in value terms at the manufacturers’ level (i.e., excluding the value of features and services added between the manufacturer and end user). For purposes of this report, the value of installed glazing is included in the market value for all window and door products:
-
Demand in unit terms for windows and exterior doors is determined by the number of openings that are filled.
-
Interior door units are counted by the slab (e.g., a bifold interior door would count as two interior door units).
Historical data for 2013, 2018, and 2023 and forecasts for 2028 and 2033 are presented in US dollars and units. The study also presents unit demand and average pricing data for window and door products.
As data in this report are at manufacturers’ level, the value of any features and services added between the manufacturer and end user are excluded.
Also for the purposes of this study, windows and doors classified as “energy efficient” are those products that meet current ENERGY STAR criteria, while those classified as “impact resistant” are those that meet local and regional building code requirements for being able to withstand high winds or impacts.
To avoid double counting, parts and components sold to, or imported by, door manufacturers for assembly into new windows and doors are excluded from the scope of this study. The value of these products is included here when they are sold as part of an integrated new window or door unit. The value of installed glazing is included in the demand numbers for all window and door products.
Also excluded from the study scope are:
-
replacement window and door components and accessories, including separately sold frames, sashes, screens, hinges, locks, latches, and weatherstrip
-
separately sold hardware not typically sold as part of the window or door unit (e.g., door knobs, locks, door stops, garage door openers)
-
components that convert doors to handicap accessible units
-
windows and doors for automobiles and other transportation equipment and vehicles
-
windows and doors that are part of cabinets or furniture
-
fencing gates
-
shower doors and bathroom stall doors
-
elevator doors
-
pet doors
-
moulding and trim
-
strip doors
Window and door demand is segmented into the following product types:
-
prime windows (double- and single-hung, casement, horizontal sliding, horizontal swing – also known as awning or hopper)
-
specialty windows (curtain wall with an infill of glass, storefront, stationary, skylight, storm, roof, tilt-turn, louvered, decorative, and glass block)
-
interior doors (wood panel, solid-core wood flush, hollow-core wood flush molded wood, bifold, louver, pocket, swinging, barn, pantry, and manifold)
-
exterior doors (manual entry, automated, patio, residential garage, commercial overhead, storm, screen, manually operated revolving, and security)
Demand is also provided in terms of market:
-
residential (new and replacement single-family, multifamily, and manufactured housing)
-
commercial (new and replacement office, retail, and lodging; institutional; industrial; and transportation and other commercial structures)
Window and door demand is broken out for the following US geographic regions and subregions:
-
Northeast (Middle Atlantic and New England)
-
Midwest (East North Central and West North Central)
-
South (South Atlantic, East South Central, and West South Central)
- West (Mountain and Pacific)
- Executive Summary
- Figure 1-1. Vinyl Windows & Doors Market Outlook
- About This Report
- Report Details
- Study Scope & Product Description
- Short-Term Vinyl Windows & Doors Trends
- Table | Vinyl Window & Door Demand by Product & Market, 2021 – 2025 (million dollars & thousand units)
- Figure 2-1. Vinyl Window & Door Demand, 2021 – 2025 (annual % change)
- Overview
- Historical Market Trends & Growth Factors
- Table | Vinyl Window & Door Demand, 2013 – 2023 (million dollars & thousand units)
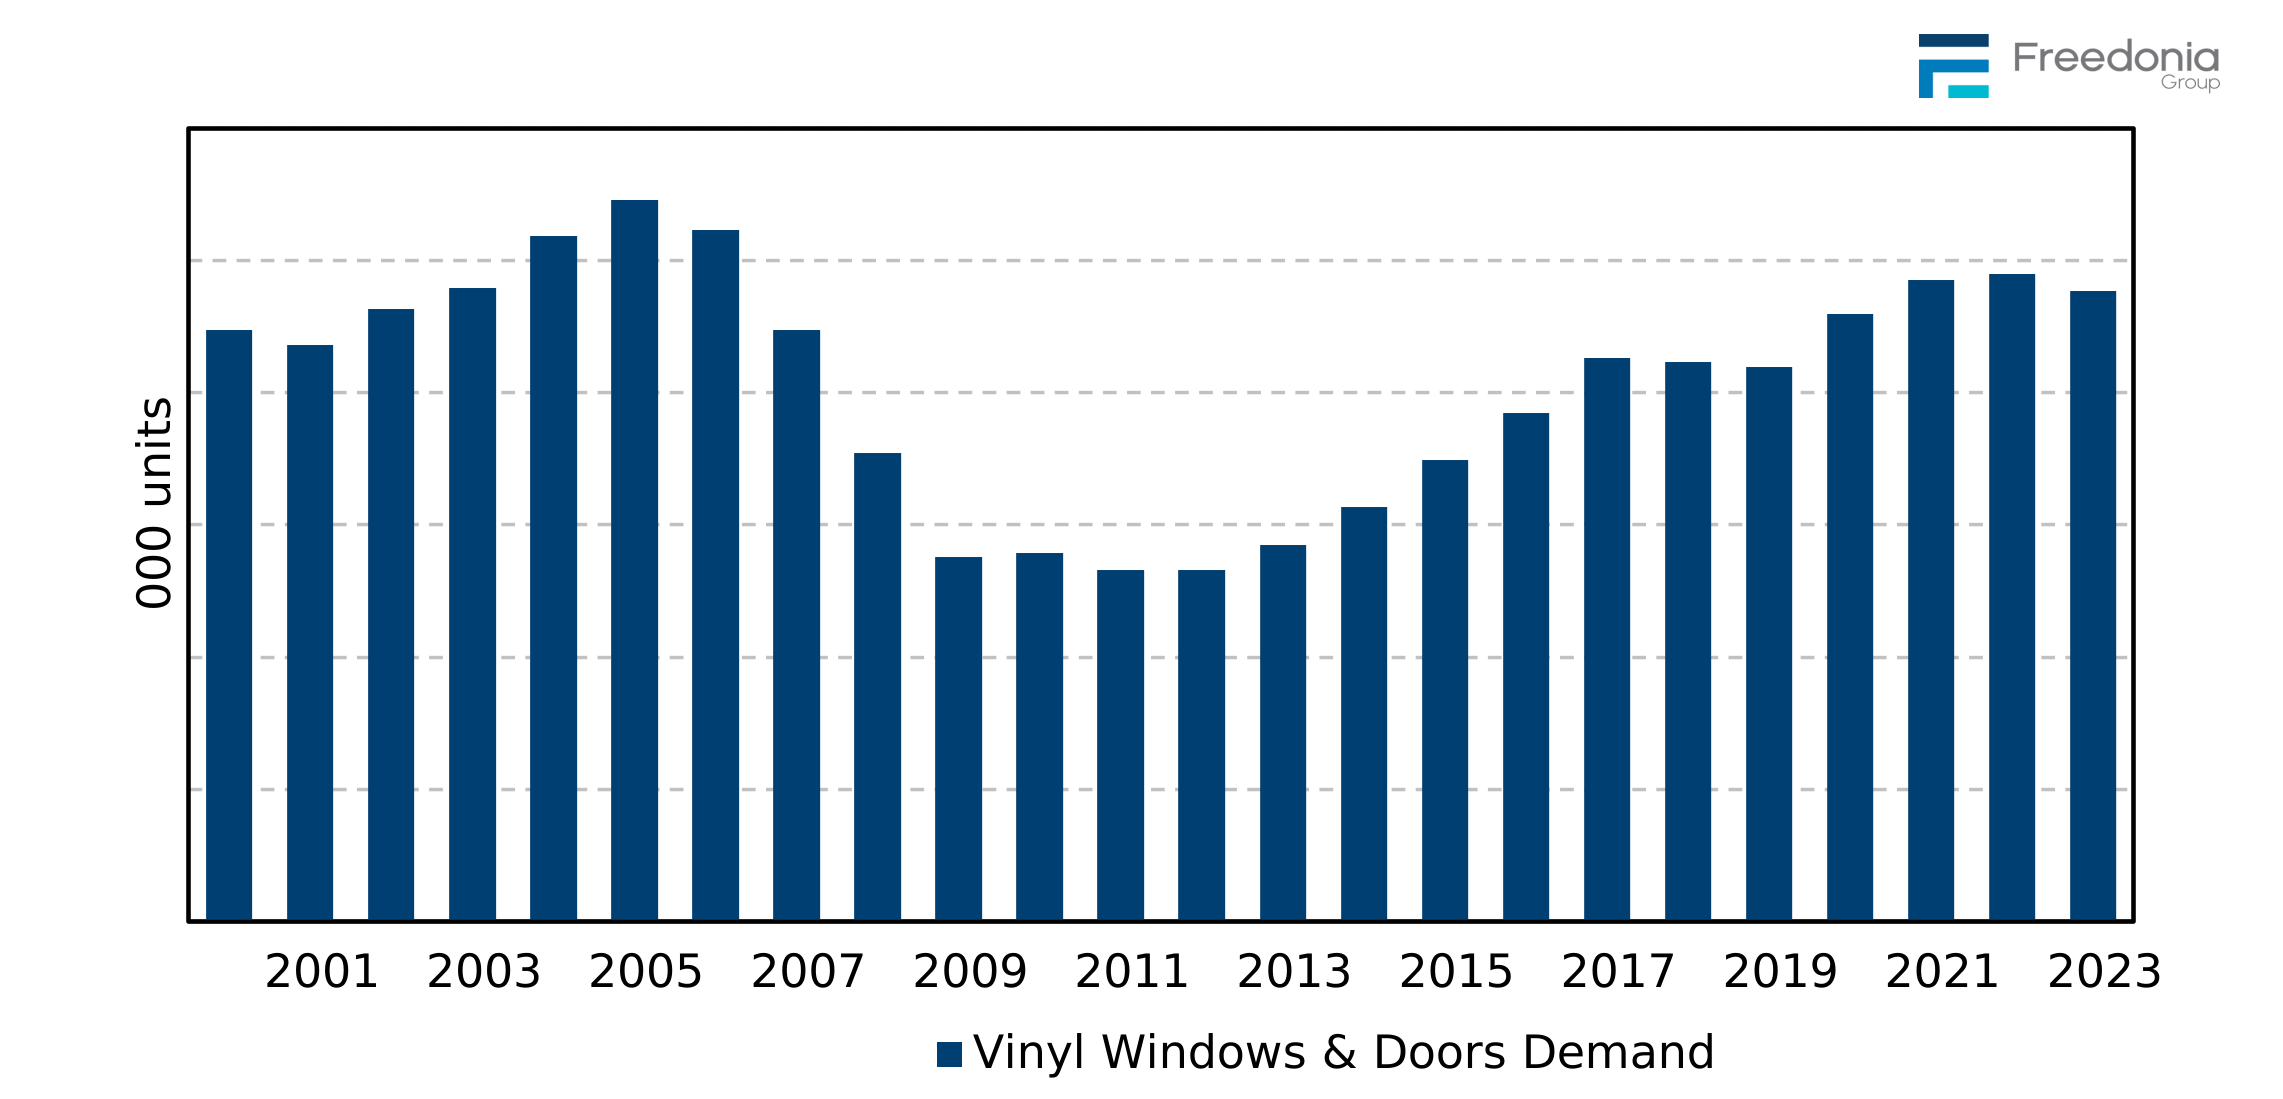
- Figure 3-1. Vinyl Window & Door Demand, 2000 – 2023 (thousand units)
- Demand by Market
- Table | Vinyl Window & Door Demand by Market, 2013, 2018, 2023, 2028, &2033 (million dollars & thousand unit
- Figure 3-2. Vinyl Window & Door Demand by Market, 2013, 2018, 2023, 2028, &2033 (million dollars)
- Demand by Material (PVC vs. WPC)
- Table | Vinyl Window & Door Demand by Material, 2013, 2018, 2023, 2028, &2033 (million dollars)
- Inflation & Pricing Trends
- Table | Selected Vinyl Window & Door Pricing by Product 2013, 2018, 2023, 2028, &2033 (dollars per unit)
- Figure 3-3. Average Vinyl Window & Door Pricing, 2013 – 2028 (dollars per unit)
- Key Suppliers
- Historical Market Trends & Growth Factors
- Factors Impacting Window & Door Demand
- Construction Industry Outlook
- Figure 4-1. Building Construction Activity by Market, 2000 – 2028 (billion 2017 dollars)
- Average Home Size
- Figure 4-2. Housing Starts: Average Unit Size by Type, 2023 – 2028 (square feet per unit)
- Building Codes
- Industry Standards & Specifications
- Green Building Certification Programs
- ICC Programs
- ENERGY STAR
- Figure 4-3. ENERGY STAR Version 7.0 Residential Windows & Doors Criteria
- LEED
- Recycling & Recycled Content
- Style Trends & Curb Appeal
- Performance & Efficiency Trends
- Glazing Technology: Low-E Glass, Smart Glass, &Energy-Efficient Spacers
- Integrated Security Features
- Universal Design Principles
- Construction Industry Outlook
- Vinyl Windows
- Scope & Product Description
- Vinyl Window Products Overview
- Table | Vinyl Window Demand by Product, 2013, 2018, 2023, 2028, &2033 (million dollars & thousand units)
- Figure 5-1. Vinyl Window Demand by Product, 2013, 2018, 2023, 2028, &2033 (million dollars)
- Double- & Single-Hung Windows
- Figure 5-2. Double- & Single-Hung Windows: Product Examples
- Table | Vinyl Double- & Single-Hung Window Demand by Type & Market, 2013, 2018, 2023, 2028, &2033 (million d
- Table | Double- & Single-Hung Windows: Uses, Advantages & Disadvantages
- Casement Windows
- Figure 5-3. Casement Windows: Product Examples
- Table | Vinyl Casement Window Demand by Market, 2013, 2018, 2023, 2028, &2033 (million dollars & thousand un
- Table | Casement Windows: Uses, Advantages & Disadvantages
- Horizontal Sliding Windows
- Figure 5-4. Horizontal Sliding Windows: Product Examples
- Table | Vinyl Horizontal Sliding Window Demand by Market, 2013, 2018, 2023, 2028, &2033 (million dollars & t
- Table | Horizontal Sliding Windows: Uses, Material Trends, &Advantages & Disadvantages
- Horizontal Swing (Awning/Hopper) Windows
- Figure 5-5. Horizontal Swing Windows: Product Examples
- Table | Horizontal Swing Window (Awning & Hopper) Demand by Market, 2013, 2018, 2023, 2028, &2033 (million d
- Table | Horizontal Swing Window (Awning & Hopper): Uses, Advantages & Disadvantages
- Storm Windows
- Figure 5-6. Storm Windows: Product Examples
- Table | Vinyl Storm Window Demand by Market, 2013, 2018, 2023, 2028, &2033 (million dollars & thousand units
- Table | Storm Windows: Uses, Advantages & Disadvantages
- Stationary Windows
- Figure 5-7. Stationary Windows: Product Examples
- Table | Stationary Window Demand by Market, 2013, 2018, 2023, 2028, &2033 (million dollars & thousand units)
- Table | Stationary Windows: Uses, Material Trends, &Advantages & Disadvantages
- Other Vinyl Windows
- Table | Other Vinyl Window Demand by Market, 2013, 2018, 2023, 2028, &2033 (million dollars & thousand units
- Demand by Market
- Table | Vinyl Window Demand by Market & Application, 2013, 2018, 2023, 2028, &2033 (million dollars)
- Figure 5-8. Vinyl Window Demand by Market, 2013, 208, 2023, 2028, &2033 (million dollars)
- Residential Windows
- Table | Residential Vinyl Window Demand by Product Type, 2013, 2018, 2023, 2028, &2033 (million dollars & th
- Commercial Windows
- Table | Commercial Vinyl Window Demand by Product Type, 2013, 2018, 2023, 2028, &2033 (million dollars & tho
- Vinyl Doors
- Scope & Product Description
- Door Products Overview
- Table | Vinyl Door Demand by Product, 2013, 2018, 2023, 2028, &2033 (million dollars & thousand units)
- Figure 6-1. Vinyl Door Demand by Product, 2013, 2018, 2023, 2028, &2033 (million dollars)
- Patio Doors
- Figure 6-2. Patio Doors: Product Examples
- Table | Patio Doors: Swinging vs. Sliding Characteristics
- Table | Vinyl Patio Door Demand by Market, 2013, 2018, 2023, 2028, &2033 (million dollars & thousand units)
- Table | Patio Doors: Advantages & Disadvantages
- Storm Doors
- Figure 6-3. Storm Doors: Product Examples
- Table | Vinyl Storm Door Demand by Market, 2013, 2018, 2023, 2028, &2033 (million dollars & thousand units)
- Table | Storm Doors: Material Trends & Advantages & Disadvantages
- Interior Doors
- Figure 6-4. Interior Doors: Product Examples
- Table | Vinyl Interior Door Demand by Market, 2013, 2018, 2023, 2028, &2033 (million dollars & thousand unit
- Other Vinyl Exterior Doors
- Table | Other Vinyl Exterior Door Demand by Market, 2013, 2018, 2023, 2028, &2033 (million dollars & thousan
- Demand by Market
- Table | Vinyl Door Demand by Market & Application, 2013, 2018, 2023, 2028, &2033 (million dollars)
- Figure 6-5. Vinyl Door Demand by Market, 2013, 208, 2023, 2028, &2033 (million dollars)
- Residential Doors
- Table | Residential Vinyl Door Demand by Product Type, 2013, 2018, 2023, 2028, &2033 (million dollars & thou
- Commercial Doors
- Table | Commercial Vinyl Door Demand by Product Type, 2013, 2018, 2023, 2028, &2033 (million dollars & thous
- Residential Buildings
- Scope & Market Description
- Applications (New vs. Replacement)
- Demand by Product & Application
- Table | Residential Vinyl Window & Door Demand by Product & Application, 2013, 2018, 2023, 2028, &2033 (mill
- Figure 7-1. Residential Vinyl Window & Door Demand by Application, 2013, 2018, 2023, 2028, &2033 (mi
- New Residential Windows & Doors
- Table | New Residential Vinyl Window & Door Demand by Product, 2013, 2018, 2023, 2028, &2033 (million dollar
- Replacement Residential Windows & Doors
- Table | Replacement Vinyl Residential Window & Door Demand by Product, 2013, 2018, 2023, 2028, &2033 (millio
- Demand by Product & Application
- Housing Types
- Table | Residential Vinyl Window & Door Demand by Housing Type, 2013, 2018, 2023, 2028, &2033 (million dolla
- Figure 7-2. Intensity of Window & Door Use by Housing Type
- Commercial Buildings
- Scope & Market Description
- Applications (New vs. Replacement)
- Demand by Product & Application
- Table | Commercial Vinyl Window & Door Demand by Product & Application, 2013, 2018, 2023, 2028, &2033 (milli
- Figure 8-1. Commercial Vinyl Window & Door Demand by Application, 2013, 2018, 2023, 2028, &2033 (mil
- New Commercial Windows & Doors
- Table | New Commercial Window & Door Demand by Product, 2013, 2018, 2023, 2028, &2033 (million dollars & tho
- Replacement Commercial Windows & Doors
- Table | Replacement Commercial Vinyl Window & Door Demand by Product, 2013, 2018, 2023, 2028, &2033 (million
- Demand by Product & Application
- Building Types
- Table | Commercial Vinyl Window & Door Demand by Building Type, 2013, 2018, 2023, 2028, &2033 (million dolla
- Regions
- Demand by Region
- Table | Vinyl Window & Door Demand by Region, 2013, 2018, 2023, 2028, &2033, (million dollars)
- Northeast
- Table | Northeast: Vinyl Window & Door Demand by Product, 2013, 2018, 2023, 2028, &2033 (million dollars)
- Midwest
- Table | Midwest: Vinyl Window & Door Demand by Product, 2013, 2018, 2023, 2028, &2033 (million dollars)
- South
- Table | South: Vinyl Window & Door Demand by Product, 2013, 2018, 2023, 2028, &2033 (million dollars)
- West
- Table | West: Vinyl Window & Door Demand by Product, 2013, 2018, 2023, 2028, &2033 (million dollars)
- Demand by Region
- Appendix
- Scope
- Definitions
- Freedonia Methodology
- Study-Specific Methodology
- Sources
- Associations & Agencies
- Related Studies & Reports
- Macroeconomic Assumptions
- Economic Environment
- Table | Macroeconomic Indicators, 2013, 2018, 2023, 2028, &2033 (billion 2017 dollars)
- Demographic Trends
- Table | Population & Households, 2013, 2018, 2023, 2028, &2033 (million persons)
- Consumer Spending
- Table | Personal Consumption Expenditures, 2013, 2018, 2023, 2028, &2033 (billion 2017 dollars)
- Consumer Financing
- Table | Consumer Financing Environment, 2013 – 2023
- Building Construction
- Table | Building Construction Expenditures, 2013, 2018, 2023, 2028, &2033 (billion dollars & billion 2017 do
- Residential Building Construction
- Table | Residential Building Construction Expenditures, 2013, 2018, 2023, 2028, &2033 (billion dollars & bil
- Residential Improvement & Repairs
- Table | Residential Improvement & Repair Expenditures, 2013, 2018, 2023, 2028, &2033 (billion dollars & bill
- Commercial Building Construction
- Table | Commercial Building Construction Expenditures, 2013, 2018, 2023, 2028, &2033 (billion dollars & bill
- Commercial Building Improvements & Repairs
- Table | Commercial Building Improvement & Repair Expenditures, 2013, 2018, 2023, 2028, &2033 (billion dollar
- Nonbuilding Construction Expenditures
- Table | Nonbuilding Construction Expenditures, 2013, 2018, 2023, 2028, &2033 (billion dollars & billion 2017
- Housing Completions
- Table | New Housing Indicators, 2013, 2018, 2023, 2028, &2033 (thousand units)
- Economic Environment
In 2023 the market size for vinyl windows and doors reached over $7 bilion.
Average prices of vinyl windows and doors are projected to increase nearly 1.0% per year to $160 per unit in 2028.
Key suppliers of vinyl residential windows include Andersen, Associated Materials, Cornerstone Building Brands, JELD-WEN, MITER Brands, and Pella.