

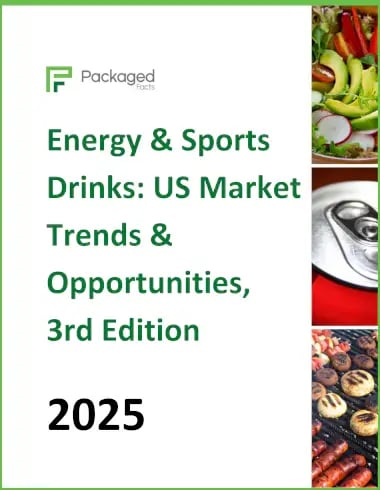
Energy & Sports Drinks: US Market Trends and Opportunities, 3rd Edition Report
This report examines the $39.3 million US retail market for energy and sports drinks. Consumer demographics, perceptions, motivations, and behavior are examined as pertaining to choices and consumption of energy and sports drinks.
Free Sample Report
Request a free sample of this report and our team will email it to you.
Report Overview
Powder Mixes Gain Share of the Energy & Sports Drink Market
These formulations will increase their market share and grow at the fastest rates due to their ability to be sold in lightweight, customizable, and e-commerce friendly packaging.
Key Themes Covered in this Report:
- Opportunities When Targeting High-Engagement Shoppers
- Understanding Consumer Attitudinal Lenses & Discovery Channels
- Intersection with Clean Labels, GLP-1 Medications, & Other Trends
This Packaged Facts report analyses the $39.3 billion US energy and sports drink market, which is projected to grow at an average rate of 5.7% annually through 2029.
Energy drinks purport to provide functional benefits like increased energy and boosts in cognitive function/brain activity. They contain stimulants, typically caffeine, and claim to provide mental and physical energy. Some of these beverages are carbonated or sweetened, and they tend to include other functional ingredients such as taurine, guarana, panax, L-carnitine, and ginseng for energy and focus.
Sports drinks are used for enhanced hydration and sports performance. They usually include electrolytes and are made to hydrate efficiently before, during, or after exercising. They tend to contain salt, minerals, and sometimes sugar to help replenish the body’s natural concentration of these substances.
This Packaged Facts report analyzes the dynamics of the current landscape of the energy and sports drink market. Consumer demographics, perceptions, motivations, and behavior pertaining to beverages and attitudes on food, diet, health, and product packaging are taken into account.
Energy drinks are segmented by the following product forms:
- Shelf-stable, non-aseptic (full-size, ready-to-drink)
- Shelf-stable shots (small-size, ready-to-drink)
- Shelf-stable drink mixes (including beverage powders)
- Liquid drink mixes (liquid concentrates)
Sports drinks are segmented by the following product forms:
- Shelf-stable, non-aseptic (full-size, ready-to-drink)
- Shelf-stable, aseptic (full-size, ready-to-drink)
- Shelf-stable drink mixes (including beverage powders)
- Liquid drink mixes (liquid concentrates)
Sales include both ready-to-drink (RTD) versions that are bottled or canned and beverage powders. Excluded from the scope of this report are:
- Revenue from beverages sold from vending machines
- Revenue from beverages sold by restaurants and other foodservice entities (such as cafeterias, bars, and caterers)
- Traditional coffee and tea (either in dry form or RTD form), which are not counted as energy drinks despite their caffeine content; some energy drinks include coffee or tea flavors or ingredients or caffeine sourced from coffee or tea extracts, but they are marketed as energy drinks with additional functional ingredients such as taurine, panax, or L-carnitine rather than just flavored coffee or tea (e.g., Starbucks RTD coffee beverages that feature sweetener and creamer/milk)
This report includes sales of the above items from:
- grocery stores, supermarkets, and discount grocers (e.g., Kroger, Safeway, ALDI)
- mass merchandisers (e.g., Walmart, Target, Meijer) and warehouse clubs (e.g., Costco, Sam’s Club, BJ’s)
- convenience stores (e.g., Pilot/Flying J, Circle K, 7-Eleven) and dollar stores (e.g., Dollar General, Family Dollar)
- other retailers, such as gift stores
- all online outlets, including online-based grocers (e.g., Amazon, Thrive Market, Boxed), third-party pack-and-deliver companies that use their own workforces to purchase groceries at various stores and deliver them to customers (e.g., Instacart), brands that sell their own food products via their websites, direct-to-consumer, and online sales from websites or apps of retailers in the previous categories
Historical numbers for the retail energy and sports drink market are provided from 2019 through 2024. Market forecasts are provided from 2025 through 2029.
The reasons for and implications of shifts in consumer perception and behavior are analyzed in the context of future market opportunities.
Additionally, the report has dozens of tables and charts showcasing numerical survey data on consumer demographics, habits, preferences, and psychographics.
Energy & Sports Drinks: US Market Trends and Opportunities, 3rd Edition Report Details
| Current Total Market Size | $39.3 billion |
| Forecast Total Market Growth Rate | 5.7% CAGR from 2024-2029 |
| Historical Period | 2019-2024 |
| Forecast Period | 2025-2029 |
| Units Covered | US dollars (current) |
| Countries Individually Covered | United States |
| Products | Energy drinks, sports drinks |
| Markets | Consumer - Retail |
| Point Where Data is Measured | Retail Point of Sale (including both e-commerce and conventional brick-and-mortar) |
| Additional Elements | Energy & Sports Drink Consumer Demographic Analysis, Psychographics of Energy & Sports Drink Consumers, Near Term Analysis of Market Size and Demand, Projections for the Next Half Decade, Growth Opportunities, Changes in Feelings of Wellbeing, Concerns About Pricing, Concerns About Health & How Food Choices Impact Health, Vitamin & Supplement Habits, Influences on Food & Beverage Consumption or Shopping |
Leading Companies Driving Trends in the Energy & Sports Drinks: US Market Trends and Opportunities, 3rd Edition
| Celsius Holdings | Monster Beverage |
| Coca-Cola | PepsiCo |
| Keurig Dr. Pepper | Prime Hydration |
| Liquid I.V. | Red Bull |
Online Grocery & DTC Channels Are Changing the Game for Energy & Sports Drinks
Online grocery and direct-to-consumer (DTC) sales are reshaping how shoppers discover and purchase energy and sports drinks. Historically, these beverages thrived on impulse buys, such as a grab from the convenience store cooler during commutes, workouts, or errands. But as more grocery and specialty beverage shopping moves online, consumers are increasingly motivated by different factors: variety, personalization, deals, and convenience.
GLP-1 Users Impacting the Energy & Sports Drinks Market
GLP-1 users tend to reduce overall caloric intake but remain drawn to beverages that provide energy, focus, and hydration efficiently. As a result, GLP-1 users are more likely to purchase low-calorie, clean-label energy and sports drinks featuring functional ingredients such as electrolytes, vitamins, and metabolism-supporting compounds. These consumers – health-conscious and willing to pay more for quality – represent a pivotal growth segment for energy and sports drinks.
Energy & Sports Drinks Report Scope
This report covers retail sales of energy and sports drinks, which are a segment of the larger functional beverages market.
Energy drinks are segmented by the following product forms:
- Shelf-stable, non-aseptic (full-size, ready-to-drink)
- Shelf-stable shots (small-size, ready-to-drink)
- Shelf-stable drink mixes (including beverage powders)
- Liquid drink mixes (liquid concentrates)
Sports drinks are segmented by the following product forms:
- Shelf-stable, non-aseptic (full-size, ready-to-drink)
- Shelf-stable, aseptic (full-size, ready-to-drink)
- Shelf-stable drink mixes (including beverage powders)
- Liquid drink mixes (liquid concentrates)
Sales include both ready-to-drink (RTD) versions that are bottled or canned and beverage powders. Excluded from the scope of this report are:
- Revenue from beverages sold from vending machines
- Revenue from beverages sold by restaurants and other foodservice entities (such as cafeterias, bars, and caterers)
- Traditional coffee and tea (either in dry form or RTD form), which are not counted as energy drinks despite their caffeine content; some energy drinks include coffee or tea flavors or ingredients or caffeine sourced from coffee or tea extracts, but they are marketed as energy drinks with additional functional ingredients such as taurine, panax, or L-carnitine rather than just flavored coffee or tea (e.g., Starbucks RTD coffee beverages that feature sweetener and creamer/milk)
This report includes sales of the above items from:
- grocery stores, supermarkets, and discount grocers (e.g., Kroger, Safeway, ALDI)
- mass merchandisers (e.g., Walmart, Target, Meijer) and warehouse clubs (e.g., Costco, Sam’s Club, BJ’s)
- convenience stores (e.g., Pilot/Flying J, Circle K, 7-Eleven) and dollar stores (e.g., Dollar General, Family Dollar)
- other retailers, such as gift stores
- all online outlets, including online-based grocers (e.g., Amazon, Thrive Market, Boxed), third-party pack-and-deliver companies that use their own workforces to purchase groceries at various stores and deliver them to customers (e.g., Instacart), brands that sell their own food products via their websites, direct-to-consumer, and online sales from websites or apps of retailers in the previous categories
- Executive Summary
- Economic Headwinds Continue to Shape Consumer Spending
- The Digital Retail Landscape Is Reshaping Beverage Discovery
- The GLP-1 Effect: Appetite Control Meets Functional Innovation
- From Low-Sugar to Clean Label: Mainstream Shifts in Consumer Demand
- MAHA’s Anti-Ultra-Processed Food Movement Spurs Reformulation
- Looking Ahead: Market Outlook & Strategic Implications
- Scope
- Recent Historical Trends
- Highlights
- Rising Prices: From Supply Chain Crunches to Inflation
- Many Consumers Are Concerned about Inflation & Rising Food Prices
- Table | Consumer Concerns about Rising Food Prices, 2023 – 2025 (% of consumers)
- Table | Month-to-Month Changes in Consumer Price Index (CPI) for All Food Items, 2022 – 2025 (percent change
- Tariffs to Further Inflate US Food & Beverage Prices
- Rising Prices Impact Consumer Behavior
- Cutting Back on Household Expenses
- Table | Consumer Spending on “Extras”, 2023 – 2025 (percent of consumers)
- Many Consumers Are Concerned about Inflation & Rising Food Prices
- Overview & Market Trends
- Highlights
- Online Grocery & DTC Channels: Changing the Game for Energy & Sports Drinks
- From Impulse to Intentional Discovery
- Expanding Access & Niche Exploration
- Subscriptions, Stock-Ups, &Value
- The New Impulse: Digital Serendipity
- GLP-1 Medications
- Non-Alcoholic Alternatives to Alcoholic Beverages
- The “Sober Curious” Movement: A Catalyst for Change
- Healthy Consumption
- Healthy Food
- Reduced or Zero Sugar
- Table | Consumers Who Follow a Low-Sugar Diet by Gender, Age Group, Generations, Presence of Minor Children
- Artificial Colors
- MAHA’S Fight Against Ultra-Processed Foods
- Personal Feelings of Wellbeing: Energy Levels, Focus, Stress, Anxiety
- Nutrients, Ingredients, &Desired Health Benefits Sought by Consumers
- Table | Preferences for Functional Food and Beverage Ingredients, 2025 (percent of consumers)
- Other Special Eating Restrictions or Preferences
- Table | Special Diets Followed by Consumers, 2025 (percent of consumers)
- Food & Beverages As a Path To Health & Wellness
- Interest in Vitamins or Other Supplements
- Purposefully Seeking Out Functional Beverages, &Willingness to Pay More for Them
- Table | Consumers Opinions on Functional Beverages, 2025 (percent of consumers)
- Market Size and Forecast
- Highlights
- Market to Advance Through 2029
- Table | Energy and Sports Drinks Retail Sales, 2019 – 2029 (million dollars, million ounces, and percent cha
- Energy & Sports Drink Sales
- Historical Trends by Product Form
- Table | Energy and Sports Drinks Retail Sales by Product Form, 2019 – 2024 (million dollars)
- Forecast by Product Form
- Table | Energy and Sports Drinks Retail Sales by Product Form, 2024, 2025E, 2026P – 2029P (million dollars)
- Historical Trends by Product Form
- Consumer Beverage Purchases & Use
- Penetration Remains Low for Energy Drinks
- Table | Consumption Rates for Energy Drinks/Shots and Sports Drinks, 2014 – 2024 (percent of adults)
- Drinks Dominate, Shots a Declining Niche
- Table | Forms of Energy Drinks/Shots Consumed, 2014 – 2024 (percent of adults that drinks energy drinks/shot
- Energy Drinkers Tend to Consume More Units
- Table | Number of Energy Drinks/Shots and Sports Drinks Consumed in Last 30 Days, 2024 (percent of adults th
- Packaging of Purchased Sports & Energy Drinks
- Table | Forms of Beverage Packaging Purchased by Type of Beverage, 2025 (percent of consumers purchasing eac
- Sports & Energy Drink Retail Channels
- Table | “Where Do You Usually Buy Sports & Energy Drinks?”, 2025 (percent of consumers)
- Day Part Consumption
- Table | “What Time of Day Do You Usually Consume Sports & Energy Drinks?”, 2025 (percent of consumers)
- Brand Choices
- Table | “What Influences Your Choice of Brand For Sports & Energy Drinks?”, 2025 (percent of consumers)
- Penetration Remains Low for Energy Drinks
- Opportunities to Target Particular Demographic Groups
- Older Consumers
- Families with Children
- Gamers
- Consumer Demographics
- Highlights
- Frequency of Purchases of Sports & Energy Drinks
- Trends by Gender
- Table | Frequency of Purchases of Sports Drinks by Gender, 2025 (percent of consumers)
- Table | Frequency of Purchases of Energy Drinks by Gender, 2025 (percent of consumers)
- Trends by Gender
- Trends by Age Bracket
- Table | Frequency of Purchases of Sports Drinks by Age Bracket, 2025 (percent of consumers)
- Table | Frequency of Purchases of Energy Drinks by Age Bracket, 2025 (percent of consumers)
- Trends by Generation
- Table | Frequency of Purchases of Sports Drinks by Generation, 2025 (percent of consumers)
- Table | Frequency of Purchases of Energy Drinks by Generation, 2025 (percent of consumers)
- Patterns Based on Household Income
- Table | Frequency of Purchases of Sports Drinks by Household Income, 2025 (percent of consumers)
- Table | Frequency of Purchases of Energy Drinks by Household Income, 2025 (percent of consumers)
- Urban, Suburban, &Rural Consumers
- Table | Frequency of Purchases of Sports Drinks by Urban, Suburban, Rural Living, 2025 (percent of consumers
- Table | Frequency of Purchases of Energy Drinks by Urban, Suburban, Rural Living, 2025 (percent of consumers
- Presence of Children in the Household
- Table | Frequency of Purchases of Sports Drinks by Presence of Children in the Household, 2025 (percent of c
- Table | Frequency of Purchases of Energy Drinks by Presence of Children in the Household, 2025 (percent of c
- Interests Among GLP-1 Users
- Table | Frequency of Purchases of Sports Drinks by Interest in & Use of GLP-1 Medications, 2025 (percent of
- Table | Frequency of Purchases of Energy Drinks by Interest in & Use of GLP-1 Medications, 2025 (percent of
- Trends With Clean Label Dieters
- Table | Frequency of Purchases of Sports Drinks by Adherence to a Clean Label Diet, 2025 (percent of consume
- Table | Frequency of Purchases of Energy Drinks by Adherence to a Clean Label Diet, 2025 (percent of consume
- Outlook With Low-Sugar Diet Adherents
- Table | Frequency of Purchases of Sports Drinks by Adherence to a Low-Sugar Diet, 2025 (percent of consumers
- Table | Frequency of Purchases of Energy Drinks by Adherence to a Low-Sugar Diet, 2025 (percent of consumers
Energy and sports drink product forms include shelf-stable, non-aseptic; shelf-stable drink mixes; liquid drink mixes; shelf-stable energy shots; shelf-stable, aseptic sports drinks.
Energy drinks are the largest category of energy and sports drinks, accounting for two-thirds of total sales.
The Energy & Sports Drink report does not cover: beverages sold from vending machines; energy and sports drink sales from restaurants and other foodservice entities such as cafeterias, bars, and caterers; traditional coffee and tea (either in dry form or RTD form), which are not counted as energy drinks despite their caffeine content – some energy drinks include coffee or tea flavors or ingredients or caffeine sourced from coffee or tea extracts, but they are marketed as energy drinks with additional functional ingredients such as taurine, panax, or L-carnitine rather than just flavored coffee or tea (e.g., Starbucks RTD coffee beverages that feature sweetener and creamer/milk)