Industry Reports
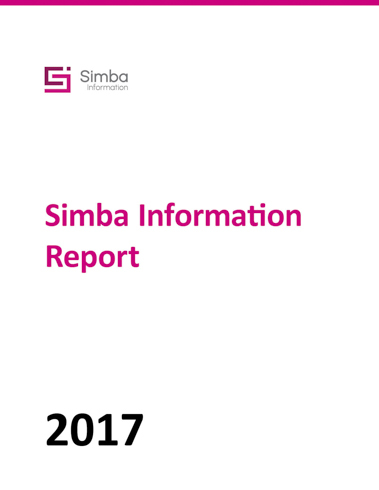
Deployment of Desktops, Laptops and Chromebooks in K-12 Schools 2017
This report provides data on the availability of computing devices in classrooms, with a particular focus on the shift away from desktop computers to laptops and Chromebooks.
Free Sample Report
Request a free sample of this report and our team will email it to you.
Report Overview
Deployment of Desktops, Laptops & Chromebooks in K-12 Schools 2017 provides data on the availability of computing devices in classrooms, with a particular focus on the shift away from desktop computers to laptops and Chromebooks, and information on what brands of laptops and Chromebooks are most used in schools. The data comes from a large-scale survey of educators and Simba Information’s ongoing research on the K-12 education market.
- Methodology
- Table | National Survey of K-12 Technology Usage Survey Sample Matrix by Job Title
- Table | National Survey of K-12 Technology Usage Survey Sample Matrix by Grade Level
- Table | National Survey of K-12 Technology Usage Survey Sample Matrix by District Size
- Executive Summary
- Introduction
- Table | Profile of Computing Devices in K-12, 2013-2014
- Ratio of Students to Computing Devices
- Table | 2016-2017 Overall Ratio of Students to Computing Devices
- Table | 2016-2017 Ratio of Students to Computing Devices, as reported by Survey Subgroup
- Table | Time Frame for Reaching the 1:1 Computing Goal
- Inventory of Desktops, Laptops & Chromebooks
- Table | Estimated Number of Computing Devices by Type, 2016
- Laptop and Chromebooks Brands in K- 12
- Table | Most Popular Laptop Brands in K-12
- Table | Most Popular Chromebook Brands in K-12
- Table | Future Trends in Computer Deployment
- Time Students Spend Using Devices
- Table | Time Students Spend Using Computing Devices
- Schedule for Acquiring New Devices
- Table | Schedule for Replacing/Acquiring Devices
- Sources of Technology Funding
- Table | Funding Used to Purchase Classroom Technology
- Technology Spending Trend
- Table | Technology Spending Changes, 2016-2017 School Year
- Effect of Technology Spending on Instructional Materials
- Table | Subgroups Most and Least Likely to Divert Funds for Technology
- Conclusion
- Table | Estimated Number of Computing Devices by Type, 2016 vs. 2014
- Appendix