US Flooring Market – Industry Research Report
This Freedonia industry study analyzes the $43 billion US flooring industry. It presents historical demand data (2012, 2017, and 2022) and forecasts (2027 and 2032) by product (resilient, nonresilient, carpets and rugs) and market (residential, nonresidential, transportation).
Free Sample Report
Request a free sample of this report and our team will email it to you.
Report Overview
 Continuing interest in home improvement and rebounding motor vehicle production drives growth.
This Freedonia industry study analyzes the $43 billion US flooring industry. It presents historical demand data (2012, 2017, and 2022) and forecasts (2027 and 2032) by product (resilient, nonresilient, carpets and rugs) and market (residential, nonresidential, transportation). Annual historical data and forecasts are also provided from 2019 to 2026. The study also evaluates company market share and competitive analysis on industry competitors including AHF Products, Shaw, Dixie Group, Engineered Floors, Mannington Mills, Interface, Mohawk Industries, and Tarkett.
Featuring 115 tables and 36 figures – available in Excel and Powerpoint! Learn More
Check out the Flooring blog!
Through 2027, US demand for flooring products is forecast to rise 2.5% per year to 30.6 billion square feet, valued at $54.3 billion. Going forward, market advances will be supported by:
-
continuing consumer interest in home improvement projects – such as kitchen and bathroom remodeling – that frequently entail the replacement of older or worn flooring
-
heightened end user interest in replacing flooring before the end of its useful life with materials that offer better aesthetic or performance properties, such as luxury vinyl tile (LVT)
-
rising commercial building construction, boosting demand for vinyl, ceramic, and carpet tile products
LVT to Become Most Popular Product in US, Ending Carpet’s Decades-Long Dominance
In 2024, LVT is projected to surpass carpeting as the most popular flooring product in the US. Over the last decade, growth in luxury vinyl tile has been explosive; it ranks among the fastest-growing flooring products ever introduced to the US. Volume demand for LVT rose 28% per year from 2012 to 2022, increasing in share from 4% to 31% of the total market. Demand has been, and will continue to be, supported by the product’s favorable performance properties relative to carpet – easy installation, superior aesthetics, and improved durability.
Residential Remodeling Continues to Drive US Flooring Market
The residential remodeling market accounted for 53% of total US flooring demand in 2022, making it the largest market segment of the industry. Although gains will not be as robust as they were during the 2017-2022 period – when home renovation projects surged in 2020 and 2021 as a result of the pandemic – they will be sizable. Demand will continue to be supported by the country’s large stock of older homes, many of which have large expanses of installed carpeting; the owners of many such residences will opt to replace their flooring, and frequently do so with hard surface products. Those that look like wood or natural stone will particularly benefit, as they fit modern design trends.
Rising Motor Vehicle Production Aids Demand for Carpets
Although carpet demand will decline due to a shift away from wall-to-wall tufted carpeting, greater losses will be offset by improving motor vehicle production, which had declined markedly during the pandemic. Motor vehicle production declined in 2020 due to a combination of supply chain issues – most notably a semiconductor shortage – and high interest rates, and has been slow to recover despite healthy consumer demand. With most supply chain issues having either resolved themselves or eased significantly, motor vehicle production is poised to grow at a rate more in line with pre-pandemic periods. As such, demand for needlepunch carpeting – which accounts for most transportation demand – will improve significantly.
Historical Market Trends
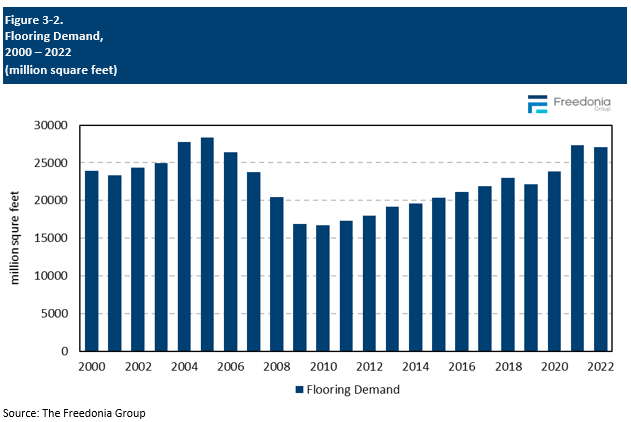
Annual flooring demand is most heavily influenced by trends in the construction industry. Demand for flooring in volume terms is somewhat insulated from economic variations in new construction activity because of the significant replacement need in residential and commercial building applications:
-
A large base of installed flooring is subject to high levels of wear and will require replacement at some point as a matter of course.
-
Flooring may be damaged before the end of its lifespan by building fires or severe weather, requiring new flooring to be installed.
-
Flooring also serves a decorative purpose, so it may be replaced before the end of its product lifespan if a consumer desires to change the appearance of the structure in which they are installed.
The US market for flooring is somewhat more insulated from volatility in volume terms because of large replacement demand, both in residential and commercial building construction applications. However, outbreaks of severe weather – particularly those accompanied by heavy precipitation – can cause carpets and rugs to become wet or damage hardwood, laminate, and vinyl composition tile flooring. In most cases, these materials must be replaced and new flooring installed
Volatility in flooring market value can be more extreme than that seen in unit terms due to spikes in product pricing. For example, in 2021 and 2022, pandemic-related supply chain issues and high raw material costs led to flooring price increases than in turn caused value demand to be somewhat less tethered to area demand.
Demand by Flooring Type
Demand for flooring in the US is projected to advance 2.5% per year through 2027 to 30.6 billion square feet. Market value will rise 4.7% annually to $54.3 billion in 2027.
Resilient flooring, primarily LVT, continues to gain share at the expense of carpets and rugs and is expected to provide the vast majority demand growth in area terms. Nonresilient flooring will also see gains, although the cost effectiveness and performance of LVT has cut into nonreslient’s share of the market. Nevertheless, both types of hard surface flooring will benefit from:
-
continuing consumer preference for hard surface flooring instead of installed carpeting
-
increasing efforts by homebuilders to make their properties more desirable to potential purchasers by adding hard surface flooring in parts of a home where it was not traditionally specified, such as living and family rooms
-
homeowners looking to improve the appearance and value of their residences by installing hard surface flooring, especially products that resemble natural wood or stone
-
commercial building owners and manufacturers looking to reduce maintenance and replacement costs by removing carpeting and opting for hard surface flooring
Carpet and rug demand is expected to decline in area terms, restrained by a sharp contraction in the use of wall-to-wall tufted carpeting in residential remodeling applications – the largest market for these products – as consumers increasingly opt for hard surface flooring, particularly LVT.
Demand by Market
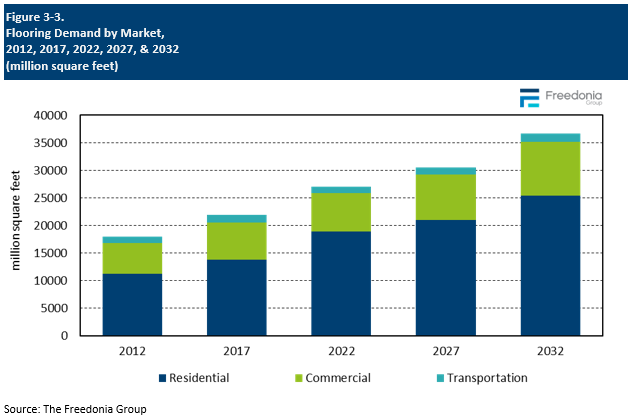
Demand for flooring in the US is projected to advance 2.5% per year through 2027 to 30.6 billion square feet. Market value will rise 4.7% per year to $54.3 billion in 2027.
The residential market accounted for the largest share of US flooring demand in 2022 with a 70% share due to the:
-
large number of residences (especially single-family homes) erected in any given year
-
large stock of existing homes, many of which have installed carpeting that is well past its recommended product lifespan
-
much higher propensity of homeowners (compared to commercial building owners) to replace flooring for aesthetic as well as performance reasons
While growth will be restrained by weak housing construction outlook, demand for residential flooring will be supported by:
-
increases in average housing unit sizes for single-family and multifamily homes
-
continuing homeowner interest in home improvement projects (such as kitchen and bathroom remodeling) that often call for the replacement of existing flooring and the installation of new materials
Demand for flooring in the commercial market is forecast to rise at a faster rate than residential, supported by a rebound in new commercial building construction and an acceleration in commercial building remodeling.
Consumption of flooring in the transportation equipment is expected to rebound, in tandem with motor vehicle production.
Inflation & Pricing Trends
Average prices for flooring are impacted by a variety of factors, including price variations in raw material and energy costs, as well as tariffs imposed on imports.
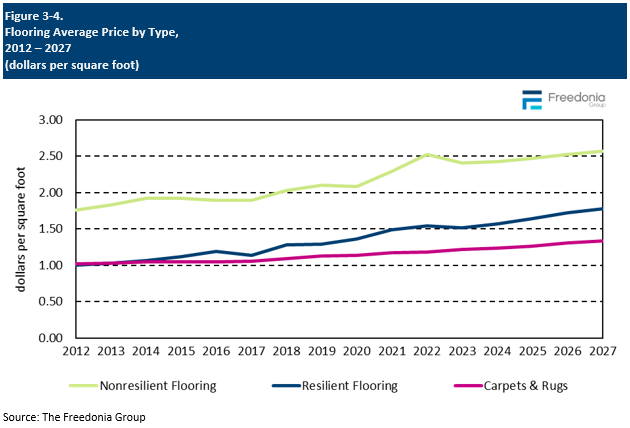
The average price for flooring products is projected to increase 2.2% per year to $1.78 per square foot in 2027. This will represent a deceleration from the 2017-2022 period, when prices spiked in 2021 2022. These spikes were a delayed result of the COVID-related temporary shutdowns of many manufacturing facilities. Once the global economy began to open back up in 2021, the effects of these shutdowns were felt by flooring producers, as supply was not able to keep pace with demand as construction activity increased at a solid pace:
-
Supply chain issues and raw material shortages caused a spike in prices for wood and plastic based flooring materials.
-
Ceramic producers saw an unusual increase in prices due to increasing natural gas prices, as the production of ceramic tile is highly natural gas intensive.
Going forward, price growth will be supported by:
-
the increasing use of higher value LVT products, such as stone-plastic composite and wood-plastic composite
-
the introduction of higher value carpeting as a means of luring consumers away from LVT and other hard surface flooring
- ongoing increases in the cost of materials used to make these products
Check out the Flooring blog!
Through 2027, US demand for flooring products is forecast to rise 2.5% per year to 30.6 billion square feet, valued at $54.3 billion. Going forward, market advances will be supported by:
-
continuing consumer interest in home improvement projects – such as kitchen and bathroom remodeling – that frequently entail the replacement of older or worn flooring
-
heightened end user interest in replacing flooring before the end of its useful life with materials that offer better aesthetic or performance properties, such as luxury vinyl tile (LVT)
-
rising commercial building construction, boosting demand for vinyl, ceramic, and carpet tile products
LVT to Become Most Popular Product in US, Ending Carpet’s Decades-Long Dominance
In 2024, LVT is projected to surpass carpeting as the most popular flooring product in the US. Over the last decade, growth in luxury vinyl tile has been explosive; it ranks among the fastest-growing flooring products ever introduced to the US. Volume demand for LVT rose 28% per year from 2012 to 2022, increasing in share from 4% to 31% of the total market. Demand has been, and will continue to be, supported by the product’s favorable performance properties relative to carpet – easy installation, superior aesthetics, and improved durability.
Residential Remodeling Continues to Drive US Flooring Market
The residential remodeling market accounted for 53% of total US flooring demand in 2022, making it the largest market segment of the industry. Although gains will not be as robust as they were during the 2017-2022 period – when home renovation projects surged in 2020 and 2021 as a result of the pandemic – they will be sizable. Demand will continue to be supported by the country’s large stock of older homes, many of which have large expanses of installed carpeting; the owners of many such residences will opt to replace their flooring, and frequently do so with hard surface products. Those that look like wood or natural stone will particularly benefit, as they fit modern design trends.
Rising Motor Vehicle Production Aids Demand for Carpets
Although carpet demand will decline due to a shift away from wall-to-wall tufted carpeting, greater losses will be offset by improving motor vehicle production, which had declined markedly during the pandemic. Motor vehicle production declined in 2020 due to a combination of supply chain issues – most notably a semiconductor shortage – and high interest rates, and has been slow to recover despite healthy consumer demand. With most supply chain issues having either resolved themselves or eased significantly, motor vehicle production is poised to grow at a rate more in line with pre-pandemic periods. As such, demand for needlepunch carpeting – which accounts for most transportation demand – will improve significantly.
Historical Market Trends
Annual flooring demand is most heavily influenced by trends in the construction industry. Demand for flooring in volume terms is somewhat insulated from economic variations in new construction activity because of the significant replacement need in residential and commercial building applications:
-
A large base of installed flooring is subject to high levels of wear and will require replacement at some point as a matter of course.
-
Flooring may be damaged before the end of its lifespan by building fires or severe weather, requiring new flooring to be installed.
-
Flooring also serves a decorative purpose, so it may be replaced before the end of its product lifespan if a consumer desires to change the appearance of the structure in which they are installed.
The US market for flooring is somewhat more insulated from volatility in volume terms because of large replacement demand, both in residential and commercial building construction applications. However, outbreaks of severe weather – particularly those accompanied by heavy precipitation – can cause carpets and rugs to become wet or damage hardwood, laminate, and vinyl composition tile flooring. In most cases, these materials must be replaced and new flooring installed
Volatility in flooring market value can be more extreme than that seen in unit terms due to spikes in product pricing. For example, in 2021 and 2022, pandemic-related supply chain issues and high raw material costs led to flooring price increases than in turn caused value demand to be somewhat less tethered to area demand.

Demand by Flooring Type
Demand for flooring in the US is projected to advance 2.5% per year through 2027 to 30.6 billion square feet. Market value will rise 4.7% annually to $54.3 billion in 2027.
Resilient flooring, primarily LVT, continues to gain share at the expense of carpets and rugs and is expected to provide the vast majority demand growth in area terms. Nonresilient flooring will also see gains, although the cost effectiveness and performance of LVT has cut into nonreslient’s share of the market. Nevertheless, both types of hard surface flooring will benefit from:
-
continuing consumer preference for hard surface flooring instead of installed carpeting
-
increasing efforts by homebuilders to make their properties more desirable to potential purchasers by adding hard surface flooring in parts of a home where it was not traditionally specified, such as living and family rooms
-
homeowners looking to improve the appearance and value of their residences by installing hard surface flooring, especially products that resemble natural wood or stone
-
commercial building owners and manufacturers looking to reduce maintenance and replacement costs by removing carpeting and opting for hard surface flooring
Carpet and rug demand is expected to decline in area terms, restrained by a sharp contraction in the use of wall-to-wall tufted carpeting in residential remodeling applications – the largest market for these products – as consumers increasingly opt for hard surface flooring, particularly LVT.
Demand by Market
Demand for flooring in the US is projected to advance 2.5% per year through 2027 to 30.6 billion square feet. Market value will rise 4.7% per year to $54.3 billion in 2027.
The residential market accounted for the largest share of US flooring demand in 2022 with a 70% share due to the:
-
large number of residences (especially single-family homes) erected in any given year
-
large stock of existing homes, many of which have installed carpeting that is well past its recommended product lifespan
-
much higher propensity of homeowners (compared to commercial building owners) to replace flooring for aesthetic as well as performance reasons
While growth will be restrained by weak housing construction outlook, demand for residential flooring will be supported by:
-
increases in average housing unit sizes for single-family and multifamily homes
-
continuing homeowner interest in home improvement projects (such as kitchen and bathroom remodeling) that often call for the replacement of existing flooring and the installation of new materials
Demand for flooring in the commercial market is forecast to rise at a faster rate than residential, supported by a rebound in new commercial building construction and an acceleration in commercial building remodeling.
Consumption of flooring in the transportation equipment is expected to rebound, in tandem with motor vehicle production.

Inflation & Pricing Trends
Average prices for flooring are impacted by a variety of factors, including price variations in raw material and energy costs, as well as tariffs imposed on imports.
The average price for flooring products is projected to increase 2.2% per year to $1.78 per square foot in 2027. This will represent a deceleration from the 2017-2022 period, when prices spiked in 2021 2022. These spikes were a delayed result of the COVID-related temporary shutdowns of many manufacturing facilities. Once the global economy began to open back up in 2021, the effects of these shutdowns were felt by flooring producers, as supply was not able to keep pace with demand as construction activity increased at a solid pace:
-
Supply chain issues and raw material shortages caused a spike in prices for wood and plastic based flooring materials.
-
Ceramic producers saw an unusual increase in prices due to increasing natural gas prices, as the production of ceramic tile is highly natural gas intensive.
Going forward, price growth will be supported by:
-
the increasing use of higher value LVT products, such as stone-plastic composite and wood-plastic composite
-
the introduction of higher value carpeting as a means of luring consumers away from LVT and other hard surface flooring
- ongoing increases in the cost of materials used to make these products

- Executive Summary
- Figure 1-1. US Flooring Market, 2022
- Short-Term Analysis
- Economic Forecast
- Table | Macroeconomic Indicators, 2021 – 2025
- Figure 2-1. Real GDP by Economic Sector, 2022 – 2025
- Short-Term Construction Outlook
- Table | Construction Expenditures, 2021 – 2025
- Short-Term Flooring Industry Trends
- Table | Annual Flooring Demand by Type, 2020 - 2024
- Table | Annual Flooring Demand by Market, 2020 - 2024
- Figure 2-2. Flooring Area Demand by Market, 2020 – 2024
- Economic Forecast
- Overview
- Study Scope
- Figure 3-1. Flooring: Product Examples
- Historical Market Trends
- Table | Flooring Demand, 2012 – 2022
- Figure 3-2. Flooring Demand, 2000 - 2022
- Demand by Flooring Type
- Table | Flooring Demand by Type, 2012, 2017, 2022, 2027, &2032
- Table | Annual Flooring Demand by Type, 2019 – 2026
- Demand by Market
- Table | Flooring Demand by Market, 2012, 2017, 2022, 2027, &2032
- Table | Annual Flooring Demand by Market, 2019 – 2026
- Figure 3-3. Flooring Demand by Market, 2012, 2017, 2022, 2027, &2032
- Production & Foreign Trade
- Table | Flooring Supply & Demand, 2012, 2017, 2022, 2027, &2032
- Table | Annual Flooring Supply & Demand, 2019 - 2026
- Inflation & Pricing Trends
- Table | Flooring Average Price by Type, 2012, 2017, 2022, 2027, &2032
- Table | Annual Flooring Average Price by Type, 2019 - 2026
- Figure 3-4. Flooring Average Price by Type, 2012 - 2027
- Global Perspective
- Figure 3-5. US Share of Global Flooring Demand, 2012, 2017, 2022, 2027, &2032
- Study Scope
- Factors Impacting Flooring Demand
- Building Construction Outlook
- Figure 4-1. Building Construction Outlook, 2019 - 2027
- Sustainability Initiatives
- Recycled Content & Recycling
- Renewable Resources
- Deforestation Issues
- Indoor Air Quality Concerns
- Technology & Innovation
- Building Construction Outlook
- Carpets & Rugs
- Scope & Product Description
- Figure 5-1. Carpets & Rugs: Product Examples
- Demand by Production Process
- Table | Carpet & Rug Demand by Production Process, 2012, 2017, 2022, 2027, &2032
- Table | Annual Carpet & Rug Demand by Production Process, 2019 – 2026
- Tufted
- Table | Tufted Carpet & Rug Demand by Market, 2012, 2017, 2022, 2027, &2032
- Table | Annual Tufted Carpet & Rug Demand by Market, 2019 - 2026
- Woven
- Table | Woven Carpet & Rug Demand by Market, 2012, 2017, 2022, 2027, &2032
- Table | Annual Woven Carpet & Rug Demand by Market, 2019 - 2026
- Needlepunched & Other Carpets & Rugs
- Table | Needlepunched & Other Carpet & Rug Demand by Market, 2012, 2017, 2022, 2027, &2032
- Table | Annual Needlepunched & Other Carpet & Rug Demand by Market, 2019 - 2026
- Demand by Market
- Table | Carpet & Rug Demand by Market, 2012, 2017, 2022, 2027, &2032
- Table | Annual Carpet & Rug Demand by Market, 2019 - 2026
- Market Share
- Figure 5-2. US Carpet & Rug Market Share by Company, 2022
- Scope & Product Description
- Resilient Flooring
- Scope & Product Description
- Figure 6-1. Resilient Flooring: Product Examples
- Product Types
- Demand by Product
- Table | Resilient Flooring Demand by Product, 2012, 2017, 2022, 2027, &2032
- Table | Annual Resilient Flooring Demand by Product, 2019 – 2026
- Vinyl Flooring
- Table | Vinyl Flooring Demand by Product & Market, 2012, 2017, 2022, 2027, &2032
- Table | Annual Vinyl Flooring Demand by Product & Market, 2019 - 2026
- Figure 6-2. Annual Vinyl Flooring Demand by Product, 2012, 2017, 2022, 2027, &2032
- Other Resilient Flooring
- Table | Other Resilient Flooring Demand by Market, 2012, 2017, 2022, 2027, &2032
- Table | Annual Other Resilient Flooring Demand by Market, 2019 - 2026
- Demand by Product
- Demand by Market
- Table | Resilient Flooring Demand by Market, 2012, 2017, 2022, 2027, &2032
- Table | Annual Resilient Flooring Demand by Market, 2019 - 2026
- Market Share
- Figure 6-3. US Resilient Flooring Market Share by Company, 2022
- Scope & Product Description
- Nonresilient Flooring
- Scope & Product Description
- Figure 7-1. Nonresilient Flooring: Product Examples
- Product Types
- Demand by Product
- Table | Nonresilient Flooring Demand by Product, 2012, 2017, 2022, 2027, &2032
- Table | Annual Nonresilient Flooring Demand by Product, 2019 – 2026
- Figure 7-2. Nonresilient Flooring Demand by Product, 2012, 2017, 2022, 2027, &2032
- Porcelain Tile Flooring
- Table | Porcelain Tile Flooring Demand by Market, 2012, 2017, 2022, 2027, &2032
- Table | Annual Porcelain Tile Flooring Demand by Market, 2019 - 2026
- Wood Flooring
- Table | Wood Flooring Demand by Product & Market, 2012, 2017, 2022, 2027, &2032
- Table | Annual Wood Flooring Demand by Product & Market, 2019 - 2026
- Figure 7-3. Wood Flooring Demand by Product, 2012, 2017, 2022, 2027, &2032
- Laminate Flooring
- Table | Laminate Flooring Demand by Market, 2012, 2017, 2022, 2027, &2032
- Table | Annual Laminate Flooring Demand by Market, 2019 - 2026
- Ceramic Tile Flooring
- Table | Ceramic Flooring Demand by Market, 2012, 2017, 2022, 2027, &2032
- Table | Annual Ceramic Flooring Demand by Market, 2019 - 2026
- Other Nonresilient Flooring
- Table | Other Nonresilient Flooring Demand by Market, 2012, 2017, 2022, 2027, &2032
- Table | Annual Other Nonresilient Flooring Demand by Market, 2019 - 2026
- Demand by Product
- Demand by Market
- Table | Nonresilient Flooring Demand by Market, 2012, 2017, 2022, 2027, &2032
- Table | Annual Nonresilient Flooring Demand by Market, 2019 - 2026
- Market Share
- Figure 7-4. US Nonresilient Flooring Market Share by Company, 2022
- Scope & Product Description
- Residential Flooring
- Market Scope
- Market Outlook
- Table | Residential Flooring Demand: New vs. Replacement & Remodeling, 2012, 2017, 2022, 2027, &2032
- Table | Annual Residential Flooring Demand: New vs. Replacement & Remodeling, 2019 – 2026
- New Construction
- Table | New Residential Flooring Demand by Product, 2012, 2017, 2022, 2027, &2032
- Table | Annual New Residential Flooring Demand by Product, 2019 - 2026
- Figure 8-1. New Residential Flooring Demand by Product, 2012, 2017, 2022, 2027, &2032
- Replacement & Remodeling
- Table | Residential Replacement & Remodeling Flooring Demand by Product, 2012, 2017, 2022, 2027, &2032
- Table | Annual Residential Replacement & Remodeling Flooring Demand by Product, 2019 - 2026
- Figure 8-2. Residential Replacement & Remodeling Flooring Demand by Product, 2012, 2017, 2022, 2027,
- Demand by Product
- Table | Residential Flooring Demand by Product, 2012, 2017, 2022, 2027, &2032
- Table | Annual Residential Flooring Demand by Product, 2019 - 2026
- Figure 8-3. Residential Flooring Demand by Product, 2012, 2017, 2022, 2027, &2032
- Housing Types
- Demand by Housing Type
- Table | Residential Flooring Demand by Housing Type, 2012, 2017, 2022, 2027, &2032
- Table | Annual Residential Flooring Demand by Housing Type, 2019 - 2026
- Figure 8-4. Residential Flooring Demand by Housing Type, 2012, 2017, 2022, 2027, &2032
- Single-Family Housing
- Table | Single-Family Housing Flooring Demand by Product & Application, 2012, 2017, 2022, 2027, &2032
- Table | Annual Single-Family Housing Flooring Demand by Product & Application, 2019 - 2026
- Figure 8-5. Single-Family Housing Flooring Demand by Product, 2012, 2017, 2022, 2027, &2032
- Multifamily Housing
- Table | Multifamily Housing Flooring Demand by Product & Application, 2012, 2017, 2022, 2027, &2032
- Table | Annual Multifamily Housing Flooring Demand by Product & Application, 2019 - 2026
- Figure 8-6. Multifamily Housing Flooring Demand by Product, 2012, 2017, 2022, 2027, &2032
- Demand by Housing Type
- Consumer Insights
- Recent Purchases of Flooring
- Table | "Within the Last 12 Months, Did You or Someone in Your Household Buy or Have ny looring Purchased on
- Table | "Within the Last 12 Months, Did You or Someone in Your Household Buy or Have Carpeting or ugs Purcha
- Table | "Within the Last 12 Months, Did You or Someone in Your Household Buy or Have Hard loors Purchased on
- Project v. Standalone Purchase
- Table | Project v. Standalone "The Purchase of the looring Was…", by Flooring Type 2023
- Buyers of the Flooring
- Table | Buyer "The Purchase Was Made By…" by looring Type, 2023
- Key Factors in Selecting Flooring
- Table | Carpets & Rugs: "What Is Most Important To You When Deciding Which Type of Flooring to Buy?" by Age
- Table | Carpets & Rugs: "What Is Most Important To You When Deciding Which Type of Flooring to Buy?" by Hous
- Table | Hard Flooring: "What Is Most Important To You When Deciding Which Type of Flooring to Buy?" by Age G
- Table | Hard Flooring: "What Is Most Important To You When Deciding Which Type of Flooring to Buy?" by House
- Reason For Purchase
- Table | Carpets & Rugs: "What Was the Primary Reason for Your Recent Purchase?" by Age Group, 2023
- Table | Carpets & Rugs: "What Was the Primary Reason for Your Recent Purchase?" by Household Income, 2023
- Table | Hard Floors: "What Was the Primary Reason for Your Recent Purchase?" by Age Group, 2023
- Table | Hard Floors: "What Was the Primary Reason for Your Recent Purchase?" by Household Income, 2023
- Where the Flooring Was Purchased
- Table | Carpets & Rugs: "Where Did You Buy the Flooring?" by Age Group, 2023
- Table | Carpets & Rugs: "Where Did You Buy the Flooring?" by Household Income, 2023
- Table | Hard Floors: "Where Did You Buy the Flooring?" by Age Group, 2023
- Table | Hard Floors: "Where Did You Buy the Flooring?" by Household Income, 2023
- Recent Purchases of Flooring
- Commercial Flooring
- Market Scope
- Market Outlook
- Table | Commercial Flooring Demand: New vs. Replacement & Remodeling, 2012, 2017, 2022, 2027, &2032
- Table | Annual Commercial Flooring Demand: New vs. Replacement & Remodeling, 2019 – 2026
- New Construction
- Table | New Commercial Flooring Demand by Product, 2012, 2017, 2022, 2027, &2032
- Table | Annual New Commercial Flooring Demand by Product, 2019 - 2026
- Figure 9-1. New Commercial Flooring Demand by Product, 2012, 2017, 2022, 2027, &2032
- Replacement & Remodeling
- Table | Commercial Replacement & Remodeling Flooring Demand by Product, 2012, 2017, 2022, 2027, &2032
- Table | Annual Commercial Replacement & Remodeling Flooring Demand by Product, 2019 - 2026
- Figure 9-2. Commercial Replacement & Remodeling Flooring Demand by Product, 2012, 2017, 2022, 2027,
- Demand by Product
- Table | Commercial Flooring Demand by Product, 2012, 2017, 2022, 2027, &2032
- Table | Annual Commercial Flooring Demand by Product, 2019 - 2026
- Figure 9-3. Commercial Flooring Demand by Product, 2012, 2017, 2022, 2027, &2032
- Building Types
- Demand by Building Type
- Table | Commercial Flooring Demand by Building Type, 2012, 2017, 2022, 2027, &2032
- Table | Annual Commercial Flooring Demand by Building Type, 2019 - 2026
- Figure 9-4. Commercial Flooring Demand by Building Type, 2012, 2017, 2022, 2027, &2032
- Office, Retail, &Lodging
- Table | Office, Trade, &Lodging Flooring Demand by Product & Application, 2012, 2017, 2022, 2027, &2032
- Table | Annual Office, Trade, &Lodging Flooring Demand by Product & Application, 2019 - 2026
- Institutional
- Table | Institutional Flooring Demand by Product & Application, 2012, 2017, 2022, 2027, &2032
- Table | Annual Institutional Flooring Demand by Product & Application, 2019 - 2026
- Industrial
- Table | Industrial Flooring Demand by Product & Application, 2012, 2017, 2022, 2027, &2032
- Table | Annual Industrial Flooring Demand by Product & Application, 2019 - 2026
- Other Commercial Buildings
- Table | Other Commercial Buildings Flooring Demand by Product & Application, 2012, 2017, 2022, 2027, &2032
- Table | Annual Other Commercial Buildings Flooring Demand by Product & Application, 2019 - 2026
- Demand by Building Type
- Transportation
- Market Scope
- Demand by Product
- Table | Transportation Flooring Demand by Type & Product, 2012, 2017, 2022, 2027, &2032
- Table | Annual Transportation Flooring Demand by Type & Product, 2019 - 2026
- Motor Vehicle Flooring
- Table | Motor Vehicle Flooring Demand by Product, 2012, 2017, 2022, 2027, &2032
- Table | Annual Motor Vehicle Flooring Demand by Product, 2019 - 2026
- Other Transportation Equipment (Recreational, Aircraft, Ships, Trains)
- Table | Other Vehicle & Nonbuilding Construction Flooring Demand by Product, 2012, 2017, 2022, 2027, &2032
- Table | Annual Other Vehicle & Nonbuilding Construction Flooring Demand by Product, 2019 - 2026
- Industry Structure
- Key Findings & Industry Composition
- Table | US Flooring Sales by Company, 2022
- Market Share
- Figure 11-1. US Flooring Market Share, 2022
- Figure 11-2. US Flooring Market: Leading Supplier 2022
- Figure 11-3. US Flooring Market: Second Leading Supplier 2022
- Figure 11-4. US Flooring Market: Third Leading Supplier 2022
- Figure 11-5. US Flooring Market: Fourth Leading Supplier 2022
- Figure 11-6. US Flooring Market: Fifth Leading Supplier 2022
- Mergers & Acquisitions
- Table | Selected Mergers & Acquisitions
- List of Industry Participants
- Table | Selected Industry Participants
- Key Findings & Industry Composition
- Appendix
- Report Details
- Table | Relevant HS Codes
- Table | Relevant NAICS & SIC Codes
- Definitions
- Abbreviations
- Table | Abbreviations & Acronyms Used in Study
- Freedonia Methodology
- Study-Specific Methodology
- Data Changes from Previous Version
- Sources
- Associations & Agencies
- Related Studies & Reports
- Macroeconomic Assumptions
- Economic Environment
- Table | Macroeconomic Indicators, 2012, 2017, 2022, 2027, &2032
- Demographic Trends
- Table | Population & Households, 2012, 2017, 2022, 2027, &2032
- Building Construction
- Table | Building Construction Expenditures, 2012, 2017, 2022, 2027, &2032
- Residential Building Construction
- Table | Residential Building Construction Expenditures, 2012, 2017, 2022, 2027, &2032
- Residential Improvements & Repairs
- Table | Residential Improvement & Repair Expenditures, 2012, 2017, 2022, 2027, &2032
- Commercial Building Construction
- Table | Commercial Building Construction Expenditures, 2012, 2017, 2022, 2027, &2032
- Commercial Building Improvements & Repairs
- Table | Commercial Building Improvement & Repair Expenditures, 2012, 2017, 2022, 2027, &2032
- Housing Completions
- Table | New Housing Indicators, 2012, 2017, 2022, 2027, &2032
- Figure 12-1. New Housing Square Footage by Housing Type, 2007 - 2022
- Housing Stock
- Table | Housing Stock by Type, 2012, 2017, 2022, 2027, &2032
- Figure 12-2. Housing Stock: Share by Year of Construction, 2022
- Economic Environment
- Report Details
Materials that can be recycled and reused in flooring include PET, rubber, and glass. Wood flooring can be reclaimed from older homes, renovated, and reused.
The market size for flooring in the US is $37.8 billion.
The market size for carpets & rugs in the US in area terms is 9.9 billion square feet.
Top flooring companies include Mohawk Industries, Shaw Industries, Engineered Floors, Mannington Mills and Tarkett.