Report Overview
What countries will be significant exporters of containerboard?
This Freedonia industry study analyzes the 261 billion square meter global corrugated box industry.  It presents historical demand data (2012, 2017, and 2022) and forecasts (2027 and 2032) by region (North America, Central and South America, Western Europe, Eastern Europe, Asia/Pacific, and Africa/Mideast) and market (food and beverage, nonfood nondurable goods, e-commerce, and other markets). Containerboard demand, production, and trade are also covered. The study also evaluates company market share and competitive analysis on industry competitors, including DS Smith, International Paper, Smurfit Kappa, WestRock, and Xiamen Hexing Packaging.
Featuring 211 tables and 97 figures – available in Excel and Powerpoint! Learn More
Global demand for corrugated boxes is expected to rise 2.6% per year to 296 billion square meters in 2027, valued at $319 billion. Growth will be driven in part by a rapid rise in demand for e-commerce packaging as online purchases continue to rise globally. However, further gains will be limited by growing concerns about packaging waste and excess corrugated box usage – most notably in the e-commerce market – and competition from flexible packaging and other alternatives.
E-Commerce Drives Demand But Also Introduces Challenges for Corrugated Boxes
By 2022, demand for corrugated boxes in the global e-commerce market grew to nearly five times the level seen in 2012. Growth will remain robust as e-commerce increases its share of retail sales, with demand rising 10% annually. Demand will be driven by the US and the Asia/Pacific region, which combined will account for 71% of absolute gains.
While e-commerce has become a significant market for corrugated boxes, the forward-facing nature of e-commerce secondary packaging has caused consumers to take greater notice of the type of packaging in which an item has been shipped. These concerns – ranging from the environmental impact of packaging to the excess waste it generates – will serve as a check against even greater demand gains.
Sustainability Concerns Will Continue to Impact the Corrugated Box Market
Despite the perceived sustainability of corrugated boxes – they are the most commonly recycled packaging type, and on average new boxes contain around 50% recycled fiber – there remain ongoing concerns about the impact that boxes have on the environment and the amount of unnecessary packaging that can result from using corrugated boxes for e-commerce. This has invited competition from other packaging formats:
- Flexible packaging has benefited from concerns over excess packaging. For instance, mailers have seen increasing use for smaller, less fragile items such as books and clothing.
- E-commerce-ready packaging, in which the primary packaging for an item is designed to serve as its shipping container, thus eliminating any secondary packaging, has also risen in popularity. In some cases, more traditionally packaged items are shipped without using any secondary packaging.
However, concerns over excess packaging can be addressed through the use of “right-sized” corrugated boxes, which more closely fit the size of their contents, thus avoiding excess space that may need to be filled with additional protective packaging. Right-sizing has been an ongoing trend in higher income countries with robust e-commerce markets, such as the US, Japan, and the UK, and is expected to become more popular in developing markets going forward.
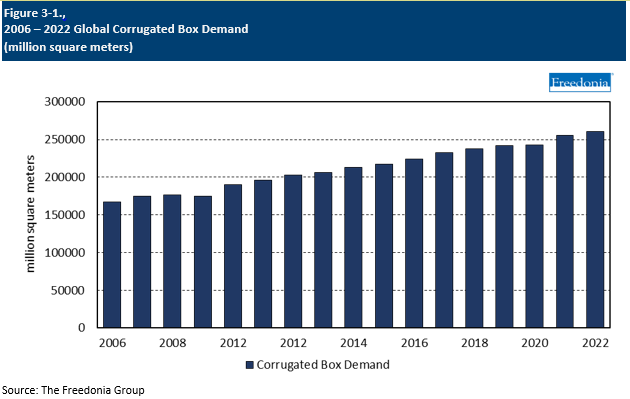
Historical Trends
A number of factors impact global demand for corrugated boxes on a year-to-year basis, although in general trends in manufacturing output, e-commerce, and product distribution play the greatest role.
Corrugated boxes are widely used in the shipping and storage of a variety of goods, and – to a lesser extent – for product packaging. As a result, demand is especially reliant on business-to-business and business-to-consumer commerce.
Other factors that impact corrugated box sales volume include:
- competition from other packaging formats, especially flexible plastic packaging
- source reduction efforts aimed at reducing the volume of raw materials used
- paper recycling levels, as recycled paper is a key raw material for box production
Unlike a number of other industries, the COVID-19 pandemic did not have a significant negative impact on corrugated box demand. Demand in volume terms stagnated in 2020, with large losses limited in part by a jump in e-commerce generated by stay-at-home orders and a general reluctance by many shoppers to shop at brick-and-mortar stores, even for necessities including food and pharmaceuticals.
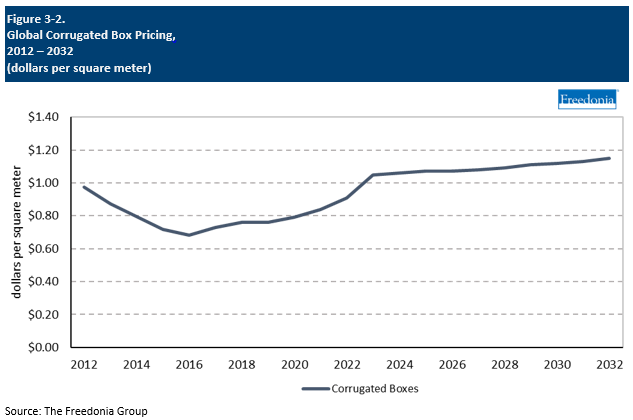
Pricing Trends
Given the growing competition from alternative packaging media, pricing is an important competitive factor in the corrugated box industry. Box prices are principally influenced by:
- trends in the global economy
- price fluctuations of raw materials
- trends in the product mix
The primary raw materials used to produce corrugated boxes are:
- recycled liner and fluting
- virgin kraft linerboard
- semichemical corrugating medium
- other materials (e.g., adhesives, inks, waxes, other coatings)
Raw material costs – primarily linerboard – have the most substantial effect on corrugated box pricing, and these costs are in turn influenced by numerous variables, such as:
- weather and climate
- paper industry supply and demand trends
- global trade issues
- general inflation
- the availability of recovered board supplies
While prices also vary between countries, general long-term pricing trends tend to follow a consistent global pattern, given the extensive level of international trade in and the commodity nature of most board grades. In addition, ongoing consolidation in the corrugated box industry is expected to lead to further adjustments in capacity, giving box-makers more power to raise prices.
Sustainability
Increasing consumer and government pressure to mitigate the environmental impact of packaging waste has driven corrugated box manufacturers to develop more sustainable products and production processes without compromising box strength and price. For example:
-
The high recovery rates and well-established recycling infrastructure for corrugated boxes in many major global markets will continue to benefit box demand.
-
Use of recycled containerboard in box production instead of higher value virgin materials enables manufacturers to brand their products as eco-friendly (e.g., “100% recycled”) while keeping costs low.
-
Increasingly, leading box firms including DS Smith and International Paper are expanding their closed-loop recycling programs to streamline efficiencies and lower costs in the production of boxes made from recycled materials.
In mature markets such as the US and Western Europe, sustainability trends have also increased the competitiveness of alternative packaging formats that can be reused, such as reusable plastic containers – particularly in the food and beverage market segment.
In addition, sustainability-motivated right-sizing trends and efforts to reduce or eliminate use of boxes in e-commerce applications – such as with e-commerce-ready packaging – will:
-
reduce the size and number of boxes needed to ship online orders, restraining box demand
-
increase use of protective mailers and other alternatives to boxes
However, rising use of box-on-demand systems that enable box customization for right-sizing purposes – which leading box firms increasingly offer to supplement revenues – will help limit competition from alternative formats in e-commerce applications.