Skip navigation
Reports & Analysis Strategic Insights Research Subscriptions
Sign In / Create Account Cart
  • Reports & Analysis
  • Strategic Insights
  • Research Subscriptions

Resources

  • Analyst Buzz
  • Press Releases
  • Blog
  • Resources & Downloads

The Freedonia Group

  • Contact
  • About
  • Our Staff
  • Help Center
  • Career Opportunities
Freedonia Market Research Freedonia Group Global Flat Glass

Global Flat Glass

Industry Reports, Global

Report Overview

Get all the new information in this new edition. 

  • Solar energy is a big and fast-growing market that wasn’t previously broken out.

  • A detailed discussion of price volatility.


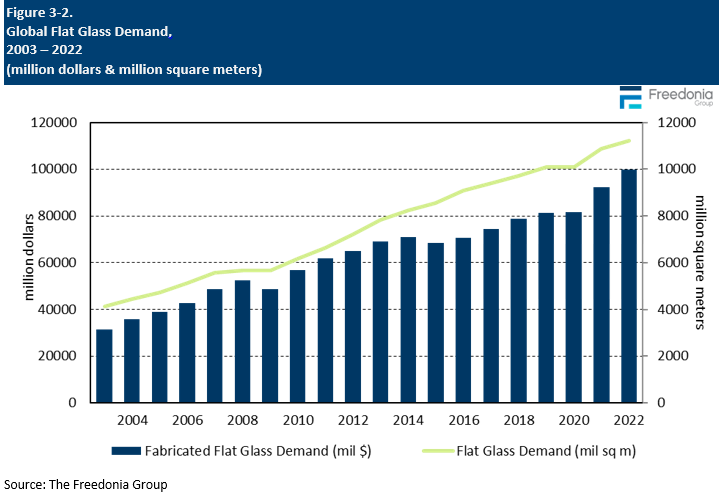
This Freedonia industry study analyzes the 11.2 billion square meter global flat glass industry. It presents historical demand data (2012, 2017, and 2022) and forecasts (2027 and 2032) by market (architectural, motor vehicle, solar energy, other markets), and region (North America, Central and South America, Western Europe, Eastern Europe, Asia/Pacific, Africa/Mideast). The study discusses the impact of the COVID-19 pandemic. The study also evaluates company market share and competitive analysis on industry competitors including AGC, Fuyao Glass Industry Group, Guardian Industries, Nippon Sheet Glass, Saint-Gobain, and Xinyi Glass.
Featuring 220 tables and 94 figures – available in Excel and Powerpoint! Learn More
This report includes data from 2011-2031 in 5 year intervals and tables featuring year-by-year data for 2018-2025.

Table of Contents

    • $323.44

    • $472.05

      • $323.44

      • $323.44

      • $323.44

      • $323.44

      • $323.44

    • $1,194.56

      • $323.44

      • $323.44

      • $323.44

      • $584.60

        • $323.44

        • $323.44

        • $323.44

        • $323.44

      • $323.44

      • $323.44

    • $323.44

      • $323.44

      • $323.44

      • $323.44

      • $323.44

        • $323.44

        • $323.44

        • $323.44

        • $323.44

        • $323.44

      • $323.44

        • $323.44

        • $323.44

      • $323.44

        • $323.44

        • $323.44

        • $323.44

        • $323.44

    • $965.87

      • $323.44

      • $323.44

      • $637.50

        • $323.44

        • $323.44

        • $323.44

      • $323.44

      • $323.44

    • $862.90

      • $323.44

      • $323.44

      • $543.88

        • $323.44

        • $323.44

        • $323.44

      • $323.44

      • $323.44

    • $323.44

      • $323.44

      • $323.44

      • $323.44

      • $323.44

    • $749.80

      • $323.44

      • $323.44

      • $478.72

        • $323.44

        • $323.44

        • $323.44

      • $323.44

    • $1,593.67

      • $323.44

      • $323.44

      • $323.44

      • $323.44

      • $323.44

      • $432.50

        • $323.44

        • $323.44

        • $323.44

        • $323.44

      • $386.57

        • $323.44

        • $323.44

        • $323.44

        • $323.44

      • $344.38

        • $323.44

        • $323.44

        • $323.44

    • $1,314.17

      • $323.44

      • $323.44

      • $323.44

      • $323.44

      • $323.44

      • $396.64

        • $323.44

        • $323.44

        • $323.44

        • $323.44

      • $451.36

        • $323.44

        • $323.44

        • $323.44

        • $323.44

    • $2,799.11

      • $323.44

      • $323.44

      • $323.44

      • $323.44

      • $323.44

      • $400.48

        • $323.44

        • $323.44

        • $323.44

        • $323.44

      • $383.10

        • $323.44

        • $323.44

        • $323.44

        • $323.44

      • $378.42

        • $323.44

        • $323.44

        • $323.44

        • $323.44

      • $370.92

        • $323.44

        • $323.44

        • $323.44

        • $323.44

      • $392.24

        • $323.44

        • $323.44

        • $323.44

        • $323.44

      • $420.51

        • $323.44

        • $323.44

        • $323.44

        • $323.44

    • $1,642.53

      • $323.44

      • $323.44

      • $323.44

      • $323.44

      • $323.44

      • $396.27

        • $323.44

        • $323.44

        • $323.44

        • $323.44

      • $384.65

        • $323.44

        • $323.44

        • $323.44

        • $323.44

      • $423.55

        • $323.44

        • $323.44

        • $323.44

        • $323.44

    • $3,703.12

      • $323.44

      • $323.44

      • $323.44

      • $323.44

      • $323.44

      • $426.37

        • $323.44

        • $323.44

        • $323.44

        • $323.44

      • $396.09

        • $323.44

        • $323.44

        • $323.44

        • $323.44

      • $391.33

        • $323.44

        • $323.44

        • $323.44

        • $323.44

      • $390.77

        • $323.44

        • $323.44

        • $323.44

        • $323.44

      • $386.57

        • $323.44

        • $323.44

        • $323.44

        • $323.44

      • $386.29

        • $323.44

        • $323.44

        • $323.44

        • $323.44

      • $386.66

        • $323.44

        • $323.44

        • $323.44

        • $323.44

      • $476.08

        • $323.44

        • $323.44

        • $323.44

        • $323.44

    • $1,664.33

      • $323.44

      • $323.44

      • $323.44

      • $323.44

      • $323.44

      • $378.97

        • $323.44

        • $323.44

        • $323.44

        • $323.44

      • $379.89

        • $323.44

        • $323.44

        • $323.44

        • $323.44

      • $461.79

        • $323.44

        • $323.44

        • $323.44

        • $323.44

    • $1,961.93

      • $323.44

      • $323.44

      • $323.44

      • $366.16

      • $323.44

      • $323.44

        • $323.44

        • $323.44

        • $323.44

      • $1,069.28

    • $3,424.08

      • $323.44

      • $323.44

      • $323.44

      • $323.44

      • $323.44

      • $323.44

      • $323.44

      • $323.44

      • $323.44

      • $2,627.53

        • $323.44

        • $323.44

        • $323.44

        • $323.44

        • $323.44

        • $1,090.42

Play Video: Global Flat Glass

Global demand for flat glass is forecast to increase 4.9% per year to 14.3 billion square meters in 2027, while fabricated flat glass demand is expected to rise 7.7% per year to $145 billion. Growth will be driven by the emerging solar energy market, as more countries expand their production capabilities for solar modules.

Demand for Solar Modules Booming Worldwide

Global manufacturing of solar modules and other solar components grew rapidly between 2017 and 2022, a trend that is expected to continue throughout the 2020s. Solar energy is a key component of efforts to improve sustainability and combat climate change, and governments worldwide are attempting to support and stimulate industry development.

The Asia/Pacific region dominated solar module production in 2021, hosting nine of the world’s ten largest manufacturers of such products. China is the region’s and world’s dominant producer, though Vietnam and Malaysia are also important centers of production. Due to the Asia/Pacific region’s comparatively developed industry, it will account for the bulk of global solar energy glass demand gains. However, many other countries – particularly the US – are poised to expand production as they attempt to develop domestic supply chains and reduce reliance on imports.

Flat glass is a key component of solar modules in that it acts as a transparent and sturdy cover for fragile solar cells – and significant development is occurring for more advanced solar glass products/applications. Transparent window glass that can generate solar power has yet to achieve large-scale commercialization, but it could be a transformative technology for building construction industries.

Motor Vehicle Market to Rebound Following COVID-19 Pandemic

The motor vehicle market for flat glass represents a particularly lucrative outlet for sales because the high degree of fabrication supports very high average product prices. This market was especially impacted by the COVID-19 pandemic, shrinking in 2020 and facing challenges to recovery in 2021 and 2022. Sales of flat glass to the motor vehicle market were constrained by global supply chain issues; an automotive chip shortage prevented automakers from fully meeting the rebounding demand. Strong growth is expected in 2023 and 2024, attributable to a resolution of the chip shortage allowing automakers to clear order backlogs and meet pent-up demand.

High Production Costs Continuing to Impact Market

The inflationary environment associated with the COVID-19 pandemic challenged flat glass producers with high costs of energy, raw materials, and logistics. As a result, prices rose significantly in 2021 and 2022; some leading firms imposed particularly large price hikes midway through 2022, affecting price levels in 2023. These increases contributed to disruption of downstream markets, the effects of which have likely not yet been fully realized. Persistent high costs could adversely affect flat glass demand by driving builders to embrace architectural styles with smaller glass areas. Glass also faces a degree of competition from plastic products, as some firms are exploring solar panels with lightweight plastic covers in place of glass.

Historical Market Cyclicality & Growth Factors

Flat glass is an essential component in a variety of industries, and demand tends to be closely tied to levels of activity in these industries. Historically, the most important drivers of demand have been:
  • building construction activity
  • motor vehicle manufacturing and maintenance
  • manufacturing of various types of durable goods, such as appliances, furniture, and consumer electronics
Use of flat glass in these applications tends to be mature, although industries may adjust their usage based on economic conditions. For example, builders may choose to emphasize designs with larger or smaller window areas based on the cost of glass relative to other materials.

The market for fabricated flat glass is also influenced by technological developments, which offer greater opportunities for sales growth in value terms compared to basic, highly commoditized float glass. Value-added fabrication technologies include laminating, tempering, and coating, with the increasing emphasis on energy efficiency and environmental friendliness driving the adoption of these features.

Flat glass is also an important component of solar energy systems, which represent a particularly strong driver of growth in this otherwise-mature industry. This market has been heavily reliant on regulatory support in the form of subsidies and incentives, which have contributed to a level of volatility. However, the solar energy market holds massive growth potential going forward.

Float glass is highly commoditized, and the costs of manufacturing these products are sensitive to the price of inputs like raw materials and energy. As a result, the market size is influenced by trends in the costs of these inputs, and demand in value terms rose considerably during the high-inflation period associated with the COVID-19 pandemic.
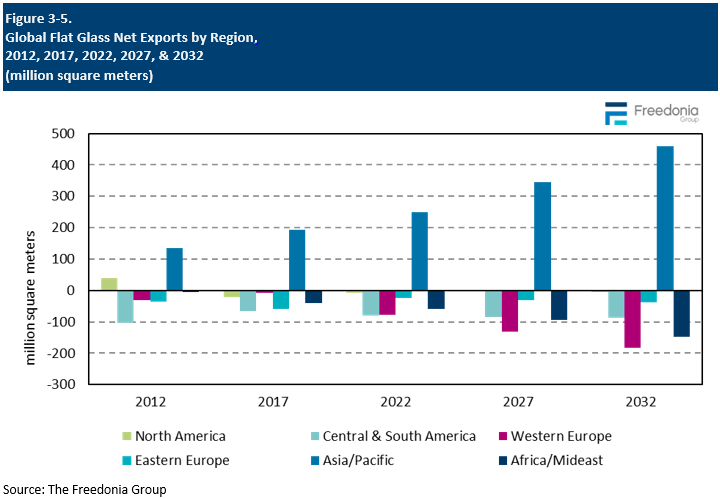
 Figure showing Global Flat Glass Demand, 2003 – 2022

International Trade

Flat glass is expensive to ship over long distances because of its weight and fragility; thus, flat glass plants tend to be situated as close as possible to the final market. Flat glass plants are also quite capital intensive to build and to operate, so it does not make economic sense to build a plant unless there is a growing and relatively stable local market for its output. For this reason, many developing countries with small markets for flat glass often import their needs, generally from neighboring countries.

China is by far the world’s largest net exporter of flat glass, meeting much of the flat glass demand of the Asia/Pacific region. Other important exporters of flat glass include:
  • Germany
  • the US
  • Indonesia
  • Iran
  • Thailand
  • Poland
Malaysia became one of the world’s largest net exporters of flat glass between 2017 and 2022, thanks to high levels of investment in offshore production by Chinese firms.

Canada, which had no operational float plants in 2022, was tied with Japan as the world’s largest net importer of flat glass. Other countries with significant trade deficits include South Korea and the UK.

The Asia/Pacific region is expected to account for an increased share of the global market through 2027, while Western Europe will see its trade deficit expand considerably. Several float glass production facilities in the region were shut down in the years following the COVID-19 pandemic, and low levels of investment in the local industry will lead to a greater need for imports as demand grows.
Figure showing Global Flat Glass Net Exports by Region

Pricing Patterns & Inflation

While there is very little differentiation in raw flat glass produced by different suppliers, local prices for raw flat glass in US dollar terms can still vary widely based on factors such as:
  • energy costs
  • fluctuating currency valuations
  • intensity of demand
  • local availability of supplies
  • local inflation
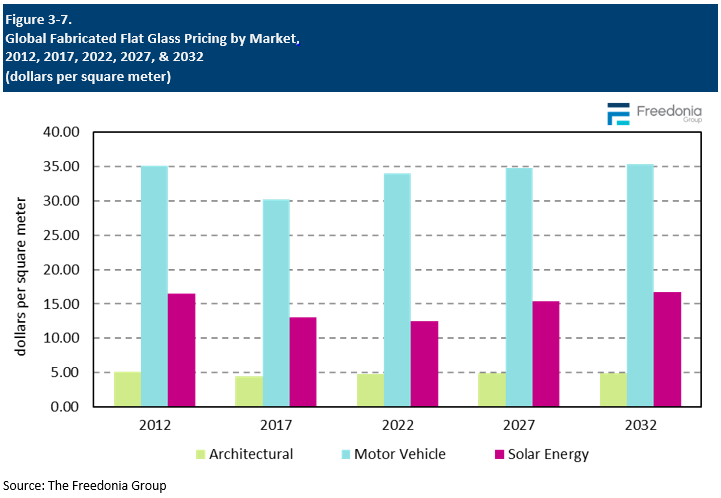
In addition, fabrication processes can have a major impact on the final value of fabricated flat glass, with some products valued at well over 10 times the price of raw flat glass:
  • Architectural products tend to be the least expensive, as architectural glass (particularly in the residential market) typically requires less extensive fabrication.
  • Motor vehicle glass is significantly more expensive, as windshields require lamination and side windows are usually tempered.
  • Aftermarket motor vehicle glass is more expensive on average than OEM glass, due to higher replacement rates for laminated windshields relative to side windows.
  • Glass for the solar energy market typically has value added from tempering.
  • Prices in other markets can vary significantly, with applications such as furniture glass on the low end and applications such as touchscreen glass for electronic products on the high end.
Global average flat glass prices in US dollar terms increased 2.3% per year between 2017 and 2022, with most of the price growth occurring over the last two years of this period. Like in many other industries, flat glass producers faced rising costs associated with the disruptions caused by the COVID-19 pandemic. Factors driving above average price increases in 2021 and 2022 were:
  • rising raw materials costs
  • high energy costs
  • logistics challenges stemming from disrupted supply chains
Figure showing Global Fabricated Flat Glass Pricing by Market
Purchase Options

Access Options

Membership

Complementary Access to Report Including:

  • consultative access to our analyst
  • unlimited downloads to reports
  • global market research in 9 languages
  • customized PPT presentations
  • passwords for your teams available
  • and more...
Become a Member
Purchase This Report

Select your license:

  • $6,400.00
  • $7,900.00
  • $9,400.00
  • — —
    Section prices in Table of Contents

Free Sample Report

A free sample report is available.

Questions & Assistance

Email us

Share This Report

Copied to clipboard. Could not copy to clipboard.

Download a Free Sample Report Now

Sample Reports include examples of all the tables, charts, infographics and topics included in this study.
By submitting this sample request you consent to receiving marketing communications from us. See our privacy policy to learn how to unsubscribe.

Use Licenses

The Single User License (SUL) authorizes a single individual to use the electronic study acquired. Agreement to the SUL is required in order to purchase the study. If you require more than one user a Departmental Site License or Global Site License should be purchased. 

The Departmental Site License (DSL) authorizes up to five users to share the study acquired. Agreement to the DSL is required in order to purchase the study. If your organization requires more than five users, the Global Site License should be purchased.

The Global Site License (GSL) allows everyone in your organization to share the study intelligence. Agreement to the Global Site License terms is necessary in order to purchase it. 

FAQs

Historically, the most important drivers of demand have been: building construction activity, motor vehicle manufacturing and maintenance and manufacturing of various types of durable goods, such as appliances, furniture, and consumer electronics.
Growth will be driven by the development of the solar energy market worldwide.
Global demand for flat glass is forecast to rise 4.9% per year to 14.3 billion square meters – valued at $145 billion – in 2027.
In 2022, the top six global suppliers of flat glass were Saint-Gobain, AGC, NSG, Guardian Industries, Xinyi Glass, and Fuyao Glass Industry.
;

Related Reports and Studies

  • Global Construction Chemicals

    Industry Reports

    This Freedonia industry study analyzes the $79.3 billion global construction chemicals industry. It presents historical demand data (2012, 2017, and 2022) and forecasts (2027 and 2032) by product (protective coatings and sealers, caulks and adhesives, cement and concrete additives, polymer flooring, grouts and mortars, asphalt additives, spray polyurethan foam, cleaners and other construction chemicals) and market (building markets, infrastructure markets).

    October 2023 457 pages
    Free sample available
  • US Window & Door Components

    Industry Reports

    This report examines the US window and door components market by component type, market, window and door type, and window and door frame material in US dollars at the manufacturers’ level (i.e., excluding the value of features and services added between the manufacturer and end user).

    NEW! April 2025 179 pages
    Free sample available
  • Global Elevators

    Industry Reports

    This study analyzes the global market for elevators (including passenger and freight elevators), escalators, and moving walkways; and associated parts that are sold separately, such as controls, doors, sensors, and power transmission equipment. Historical data (2013, 2018, 2023) and forecasts to 2028 and 2033 are presented in dollars.

    November 2024 444 pages
    Free sample available
  • Global Windows & Doors

    Industry Reports

    This study examines the global window and door market by product, material, market, and geographic region. Historical data for 2013, 2018, and 2023, and forecasts for 2028 and 2033 are provided in US nominal dollars. Additionally, annual data from 2020 to 2027 is also provided.

    NEW! January 2025 435 pages
    Free sample available
  • US Roofing

    Industry Reports

    This Freedonia industry study analyzes the $25 billion US market for roofing. It presents historical demand data (2013, 2018, and 2023) and forecasts (2028 and 2033) as well as annual data for years 2020-2027.

    June 2024 436 pages
    Free sample available
  • Global Housing

    Industry Reports

    This report examines the global housing market, with construction of new housing is projected to expand 2.4% per year through 2029 to 60 million units

    NEW! January 2025 539 pages
    Free sample available
  • US Insulation

    Industry Reports

    Demand for insulation in the US is forecast to increase 1.9% annually to 10.4 billion pounds in 2025 from a high 2020 base, which resulted from an increase in home renovation and new home construction during the pandemic.

    March 2022 206 pages
    Free sample available
  • Global Hybrid & Electric Vehicles

    Industry Reports

    The global market for hybrid and electric vehicles (HEVs) is forecast to increase 22% per year through 2026, almost tripling to 30.5 million units. Sales rose dramatically in 2021 in spite of an overall weak environment.

    May 2022 290 pages
    Free sample available
  • Global Decorative Tile

    Industry Reports

    China and India are the two largest markets for decorative tile and combined they will account for 47% of absolute gains globally. India.

    July 2022 450 pages
    Free sample available
  • US Windows & Doors

    Industry Reports

    This study examines the US market for windows and doors by product, material, market, and geographic region in value terms at the manufacturers’ level (i.e., excluding the value of features and services added between the manufacturer and end user). Historical data for 2013, 2018, and 2023 and forecasts for 2028 and 2033 are presented in US dollars and units.

    November 2024 470 pages
    Free sample available
View More

Have unique research needs?

Freedonia Strategic Insights listens intently to your needs and objectives. Then we work diligently to define a service offering to meet them.
Learn About Our Custom Research Services

Stay informed with Freedonia

Receive periodic updates about new market research in areas relevant to your business. Have the convenience of Freedonia research at your fingertips when you need it.
The Freedonia Group needs the contact information you provide to us to contact you about our products and services. You may unsubscribe from these communications at any time. For information on how to unsubscribe, as well as our privacy practices and commitment to protecting your privacy, please review our Privacy Policy.
  • Contact
  • About
  • Help Center
  • Career Opportunities
  • Press Contact
  • User Agreement
  • Privacy Policy
  • Site Map

Additional Resources

  • Market Size Resources
  • Lawn & Garden Market Research
  • Roofing Market Research
  • Pet Products Market Research
  • Countertops Market Research
  • Power Tools Market Research
  • Publishing for the PreK-12 Market Research
  • Insulation Market Resaerch
  • Cabinets Market Research
  • Flooring Market Research
  • Pet Supplements Market Research
  • Agricultural Equipment Market Research
  • Open Access Publishing Market Research
  • Silicones Market Research
  • For Legal Inquiries, contact Cohen & Cohen
Copyright © 2025 The Freedonia Group, Inc. All rights reserved.