Skip navigation
Reports & Analysis Strategic Insights Research Subscriptions
Sign In / Create Account Cart
  • Reports & Analysis
  • Strategic Insights
  • Research Subscriptions

Resources

  • Analyst Buzz
  • Press Releases
  • Blog
  • Resources & Downloads

The Freedonia Group

  • Contact
  • About
  • Our Staff
  • Help Center
  • Career Opportunities
Freedonia Market Research Freedonia Group Global Housing

Global Housing

Industry Reports, Global

Report Overview

Play Video: Global Housing
Featuring 169 tables and 244 figures

Key Trends in the Global Housing Market

  • labor costs and material costs
  • new or altered government incentives
  • trends in interest rates
  • the supply and demand gap on existing housing stock

Global construction of new housing is projected to expand 2.4% per year through 2029 to 60 million units, driven by:

  • new housing formation in countries with large population shares in the 18-24 year-old range
  • programs like Pradhan Mantri Awas Yojana in India to boost the construction of affordable housing units
  • rural-to-urban migration in lower-income countries

  • a recovery in housing construction in Western Europe, where a number of countries saw sharp contraction in housing activity in 2024

Table of Contents

    • $310.50

    • $310.50

      • $310.50

      • $310.50

      • $310.50

    • $578.14

      • $310.50

      • $320.72

        • $310.50

        • $310.50

        • $310.50

        • $310.50

        • $310.50

      • $310.50

        • $310.50

        • $310.50

        • $310.50

      • $310.50

    • $472.77

      • $310.50

      • $310.50

      • $310.50

      • $310.50

        • $310.50

        • $310.50

      • $310.50

        • $310.50

        • $310.50

    • $622.59

      • $310.50

      • $310.50

      • $310.50

      • $310.50

      • $310.50

        • $310.50

        • $310.50

        • $310.50

      • $310.50

        • $310.50

        • $310.50

        • $310.50

      • $310.50

        • $310.50

        • $310.50

        • $310.50

    • $1,119.65

      • $310.50

      • $310.50

      • $310.50

      • $310.50

      • $310.50

        • $310.50

        • $310.50

        • $310.50

      • $310.50

        • $310.50

        • $310.50

        • $310.50

      • $310.50

        • $310.50

        • $310.50

        • $310.50

      • $310.50

        • $310.50

        • $310.50

        • $310.50

      • $310.50

        • $310.50

        • $310.50

        • $310.50

      • $310.50

        • $310.50

        • $310.50

        • $310.50

      • $310.50

        • $310.50

        • $310.50

        • $310.50

    • $2,266.03

      • $310.50

      • $310.50

      • $310.50

      • $310.50

      • $310.50

        • $310.50

        • $310.50

        • $310.50

      • $310.50

        • $310.50

        • $310.50

        • $310.50

      • $310.50

        • $310.50

        • $310.50

        • $310.50

      • $310.50

        • $310.50

        • $310.50

        • $310.50

      • $310.50

        • $310.50

        • $310.50

        • $310.50

      • $310.50

        • $310.50

        • $310.50

        • $310.50

      • $310.50

        • $310.50

        • $310.50

        • $310.50

      • $310.50

        • $310.50

        • $310.50

        • $310.50

      • $310.50

        • $310.50

        • $310.50

        • $310.50

      • $310.50

        • $310.50

        • $310.50

        • $310.50

      • $310.50

        • $310.50

        • $310.50

        • $310.50

      • $310.50

        • $310.50

        • $310.50

        • $310.50

      • $310.50

        • $310.50

        • $310.50

        • $310.50

      • $310.50

        • $310.50

        • $310.50

        • $310.50

      • $310.50

        • $310.50

        • $310.50

        • $310.50

      • $310.50

        • $310.50

        • $310.50

        • $310.50

      • $310.50

        • $310.50

        • $310.50

        • $310.50

    • $1,351.70

      • $310.50

      • $310.50

      • $310.50

      • $310.50

      • $310.50

        • $310.50

        • $310.50

        • $310.50

      • $310.50

        • $310.50

        • $310.50

        • $310.50

      • $310.50

        • $310.50

        • $310.50

        • $310.50

      • $310.50

        • $310.50

        • $310.50

        • $310.50

      • $310.50

        • $310.50

        • $310.50

        • $310.50

      • $310.50

        • $310.50

        • $310.50

        • $310.50

      • $310.50

        • $310.50

        • $310.50

        • $310.50

      • $310.50

        • $310.50

        • $310.50

        • $310.50

      • $310.50

        • $310.50

        • $310.50

        • $310.50

      • $310.50

        • $310.50

        • $310.50

        • $310.50

    • $2,408.80

      • $310.50

      • $310.50

      • $310.50

      • $310.50

      • $310.50

        • $310.50

        • $310.50

        • $310.50

      • $310.50

        • $310.50

        • $310.50

        • $310.50

      • $310.50

        • $310.50

        • $310.50

        • $310.50

      • $310.50

        • $310.50

        • $310.50

        • $310.50

      • $310.50

        • $310.50

        • $310.50

        • $310.50

      • $310.50

        • $310.50

        • $310.50

        • $310.50

      • $310.50

        • $310.50

        • $310.50

        • $310.50

      • $310.50

        • $310.50

        • $310.50

        • $310.50

      • $310.50

        • $310.50

        • $310.50

        • $310.50

      • $310.50

        • $310.50

        • $310.50

        • $310.50

      • $310.50

        • $310.50

        • $310.50

        • $310.50

      • $310.50

        • $310.50

        • $310.50

        • $310.50

      • $310.50

        • $310.50

        • $310.50

        • $310.50

      • $310.50

        • $310.50

        • $310.50

        • $310.50

      • $310.50

        • $310.50

        • $310.50

        • $310.50

      • $310.50

        • $310.50

        • $310.50

        • $310.50

    • $1,610.52

      • $310.50

      • $310.50

      • $310.50

      • $310.50

      • $310.50

        • $310.50

        • $310.50

        • $310.50

      • $310.50

        • $310.50

        • $310.50

        • $310.50

      • $310.50

        • $310.50

        • $310.50

        • $310.50

      • $310.50

        • $310.50

        • $310.50

        • $310.50

      • $310.50

        • $310.50

        • $310.50

        • $310.50

      • $310.50

        • $310.50

        • $310.50

        • $310.50

      • $310.50

        • $310.50

        • $310.50

        • $310.50

      • $310.50

        • $310.50

        • $310.50

        • $310.50

      • $310.50

        • $310.50

        • $310.50

        • $310.50

      • $310.50

        • $310.50

        • $310.50

        • $310.50

    • $1,086.01

      • $310.50

      • $310.50

      • $310.50

      • $509.65

      • $310.50

      • $310.50

      • $310.50

      • $310.50

      • $310.50

      • $325.67

        • $310.50

        • $310.50

        • $310.50

While Global New Housing Will Grow, Weak Performances Are Expected for US & China

Despite the general global trend of new housing growth, two of the largest housing markets in the world – China and the US – are expected to see weaker performances:

  • China will see construction rise only marginally through 2029, beset by declining population, central government measures to curb excessive borrowing among real estate developers, and the overhang of large numbers of vacant housing units constructed in the last decade, particularly in third- and fourth-tier cities

  • In the US, completions of new housing units are expected to decline through 2029, measured against an inflated 2024 base, which saw a surge in construction of multifamily housing units.

Rural-to Urban Migration & Replacement of Substandard Housing Boosts Multifamily Units

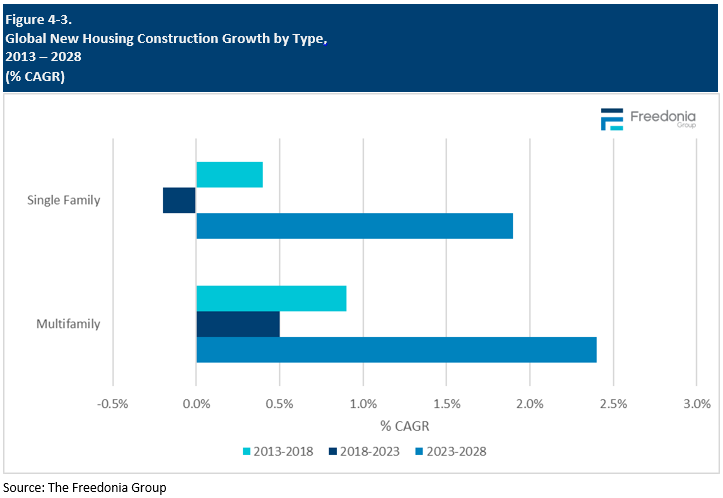
Over the forecast period, multifamily housing construction is expected to outpace construction of single-family units due to primarily to continued rural-to-urban migration in lower-income countries in Africa and Asia. India alone will account for over 40% of multifamily units built globally, supported not only by urbanization and a growing population, but also by government efforts to build affordable housing for the urban poor. In general, many of the governments in these African and Asian countries have already or will institute programs designed to reduce the share of the population that dwells in substandard housing units, often constructed informally out of repurposed materials.

Housing Stock

Regional Outlook

The global housing stock is forecast to increase 1.2% per year to 2.6 billion units in 2029, growing at the same rate as the number of households. Gains in the housing stock will be driven by:

  • new household formation and increased shelter needs

  • increasing income levels, allowing families living in shared quarters to move into their own homes and more affluent households to afford the purchase of a secondary residence

  • migration from rural areas to urban centers

  • construction of subsidized, or social, housing for low-income households to help alleviate shortages of affordable dwellings

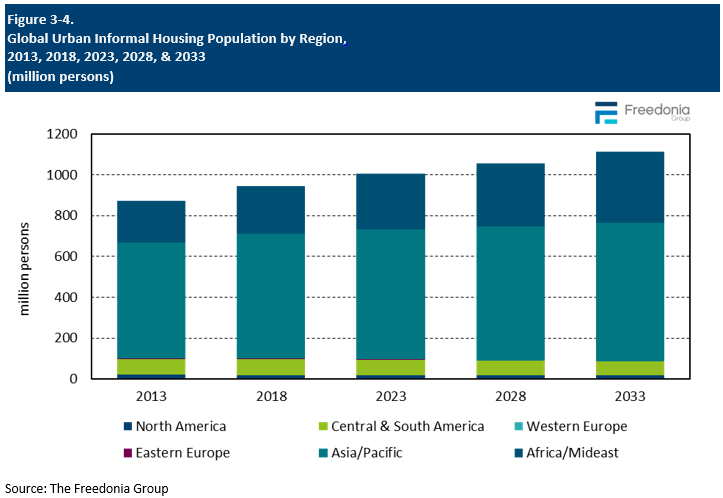
In many countries, rural-to-urban migration will stimulate growth in new housing beyond that required by population increases. Such internal population flows will test the ability of government planning agencies to respond to the increased need for urban housing. As a result, some housing needs will continue to be met by the construction of substandard, informal housing, or slums – often on land to which the dweller has unclear or no legal title.

In addition, a substantial amount of vacant housing units (built because of speculation and asset-formation) has led to the creation of “ghost cities” in countries such as China, which could discourage future property development. Governments must find a way to utilize these unoccupied housing units, especially as significant portions of their populations continue to live in informal housing and in poor living conditions.

Renovation and expansion of the existing housing stock boost residential construction expenditures but do not contribute to growth in the number of new homes. Renovation activity represents a large share of residential construction spending in industrialized countries, where:

  • populations are generally either growing slowly or declining

  • the need for an increased number of housing units is less pressing

The materials used in housing construction, as well as the quality of construction, vary across countries:

  • Some dwellings are constructed of less durable materials such as grass or cardboard, particularly in urban slums or rural areas of developing countries. Roofing and siding materials may be obtained by reclaiming used products such as corrugated metal panels or wooden crates.

  • Dwellings constructed in the formal sector are more likely to use new, durable building materials intended for the purpose, such as building boards, bricks, and asphaltic or tile roofing materials.

Developing countries in the Africa/Mideast and Asia/Pacific regions are expected to post the greatest absolute increases in population and new households. As a result, these countries will account for a significant portion of global new housing construction, boosting the size of their housing stock:

  • The Africa/Mideast region is anticipated to see the most rapid growth in the size of its housing stock of any region, as countries in the area continue to industrialize and see standards of living improve.

  • India – the world’s most populous country – will see the healthy increases in new housing construction above the average in the Asia/Pacific region, with Malaysia, Pakistan, and the Philippines also registering new housing construction gains faster than the global average.

Figure showing Global Housing Stock by Region, 2024 (billion units)

Types of Housing (Single-Family & Multifamily)

The global housing stock is segmented into single-family and multifamily types:

  • Single-family housing consists of detached, freestanding housing units, typically built on lots larger than the individual structure (including site-built and manufactured dwellings).

  • Multifamily housing units are contained in a building or complex along with other multifamily units (e.g., apartments, condominiums, townhouses).

Areas in which a larger share of the population is rural – such as many parts of the Asia/Pacific and Africa/Mideast regions – see high proportions of single-family housing. For example, in Vietnam, single-family homes account for 96% of the housing stock because of the country’s large proportion of rural, self-built homes.

Industrialized countries with low population densities per square kilometer (e.g., Australia, Canada, and the US) also tend to have larger shares of single-family dwellings, as lower population densities generally make land less expensive and more readily available, even in urban areas.

Other factors contributing to high proportions of single-family homes include:

  • less expensive land prices in rural areas

  • high per capita incomes

  • secondary vacation homes and cottages in affluent countries

  • availability of open land

By contrast, both Western and Eastern Europe have high proportions of multifamily dwellings:

  • In Western Europe, population densities are generally higher than in Australia, Canada, and the US despite generally similar levels of affluence, and multifamily units house many people with only limited use of relatively expensive land.

  • In Eastern Europe, centralized construction policies resulted in a large stock of multifamily dwellings, many of which were built in the first decade after the end of the Second World War.

High-income, densely populated Asian countries such as Singapore, Hong Kong, Taiwan, and South Korea also have among the highest rates of multifamily housing.

Growth in the global stock of multifamily housing is expected to slightly outpace gains in the number of existing single-family homes, helped by continued rural-to-urban migration and expanding construction of government-subsidized social housing, particularly in developing areas where informal housing is common. Multifamily units are typically more affordable, especially in the rental market, which has also led to increasing demand.

The size and condition of single-family and multifamily homes vary widely across the globe, with industrialized countries generally having housing units that are larger and of better quality than in developing nations. Faster advances in completions of multifamily housing will constrain growth in average unit size, as multifamily units are typically smaller than single-family homes.

Report Details

This report examines the global housing market in terms of both the global housing stock and the construction of new housing units. Historical data for 2014, 2019, and 2024 and forecasts for 2029 and 2034 are presented in units by country in the following regions:

  • North America

  • Central and South America

  • Western Europe

  • Eastern Europe

  • Asia/Pacific

  • Africa/Mideast

Housing data in this report encompass private (owner-occupied and rental), public/social housing (owner-occupied and rental), and informal housing.

Housing units are segmented by type in terms of:

  • single-family housing units

  • multifamily housing units (e.g., apartments/flats, condominiums, townhouses)

This report also includes the following data, all presented in square meters:

  • existing residential floor space

  • new residential floor space

  • average size of existing housing units

  • average size of new housing units
Purchase Options

Access Options

Membership

Complementary Access to Report Including:

  • consultative access to our analyst
  • unlimited downloads to reports
  • global market research in 9 languages
  • customized PPT presentations
  • passwords for your teams available
  • and more...
Become a Member
Purchase This Report

Select your license:

  • $3,400.00
  • $4,900.00
  • $6,400.00
  • — —
    Section prices in Table of Contents

Free Sample Report

A free sample report is available.

Questions & Assistance

Email us

Share This Report

Copied to clipboard. Could not copy to clipboard.

Download a Free Sample Report Now

Sample Reports include examples of all the tables, charts, infographics and topics included in this study.
By submitting this sample request you consent to receiving marketing communications from us. See our privacy policy to learn how to unsubscribe.

Use Licenses

The Single User License (SUL) authorizes a single individual to use the electronic study acquired. Agreement to the SUL is required in order to purchase the study. If you require more than one user a Departmental Site License or Global Site License should be purchased. 

The Departmental Site License (DSL) authorizes up to five users to share the study acquired. Agreement to the DSL is required in order to purchase the study. If your organization requires more than five users, the Global Site License should be purchased.

The Global Site License (GSL) allows everyone in your organization to share the study intelligence. Agreement to the Global Site License terms is necessary in order to purchase it. 

FAQs

China and the US have the largest housing markets in the world.
A steep decline is expected in North America from a high 2024 base caused primarily by a surge in multifamily construction in the US in that year.
Global construction of new housing is projected to expand 2.4% per year through 2029 to 60 million units.
;

Related Reports and Studies

  • US Window & Door Components

    Industry Reports

    This report examines the US window and door components market by component type, market, window and door type, and window and door frame material in US dollars at the manufacturers’ level (i.e., excluding the value of features and services added between the manufacturer and end user).

    NEW! April 2025 179 pages
    Free sample available
  • Global Drywall

    Industry Reports

    This Freedonia industry study analyzes the 11.1 billion square meters global drywall industry, valued at $23.3 billion. It presents historical demand data (2012, 2017, and 2022) and forecasts (2027 and 2032) by market and application.

    March 2024 350 pages
    Free sample available
  • Global Major Household Appliances

    Industry Reports

    This study analyzes global supply and sales of major household appliances. Historical data for 2013, 2018, and 2023 and forecasts for 2028 and 2033 are presented in current dollars (which are not adjusted for inflation) and unit terms. Historical data from 2020 to 2027 are also presented.

    September 2024 630 pages
    Free sample available
  • US Plumbing Fixtures & Fittings Report

    Industry Reports

    This study analyzes US demand for plumbing fixtures and fittings by product type, material (for fixtures), market, and region and subregion.

    NEW! May 2025 257 pages
    Free sample available
  • Global Flat Glass

    Industry Reports

    This Freedonia industry study analyzes the 11.2 billion square meter global flat glass industry. It presents historical demand data (2012, 2017, and 2022) and forecasts (2027 and 2032) by market, and region.

    June 2023 464 pages
    Free sample available
  • Global Engineered Stone Countertops

    Industry Reports

    This study analyzes the global market for engineered stone countertops (also called benchtops or worktops in some parts of the world), which includes engineered quartz, engineered marble, and polymer concrete.

    August 2024 348 pages
    Free sample available
  • US Liquid-Applied Roof Coatings

    Industry Reports

    US demand for liquid-applied roof coatings is forecast to increase 1.1% annually through 2028 to 11.91 million squares.

    January 2025 207 pages
    Free sample available
  • Global Siding (Cladding)

    Industry Reports

    This study analyzes global demand for siding. Historical demand (2014, 2019, and 2024) and forecasts for 2029 and 2034 are provided for siding demand by product (in dollars and square meters) and market (in square meters).

    NEW! March 2025 401 pages
    Free sample available
  • Global Asphalt (Bitumen)

    Industry Reports

    Examines global supply and demand in metric tons for asphalt (bitumen), including historical data for 2014, 2019, and 2024 and forecasts for 2029 and 2034, with breakouts by region, product, net exports, and production for major countries. Additionally, annual data from 2021 to 2028 is also provided.

    January 2025 312 pages
    Free sample available
  • US Gutters & Downspouts

    Industry Reports

    This Freedonia industry study analyzes the $8 billion US market for gutters and downspouts. It presents historical demand data (2012, 2017, and 2022) and forecasts (2027 and 2032) as well as annual data for years 2019-2026.

    January 2024 254 pages
    Free sample available
View More

Have unique research needs?

Freedonia Strategic Insights listens intently to your needs and objectives. Then we work diligently to define a service offering to meet them.
Learn About Our Custom Research Services

Stay informed with Freedonia

Receive periodic updates about new market research in areas relevant to your business. Have the convenience of Freedonia research at your fingertips when you need it.
The Freedonia Group needs the contact information you provide to us to contact you about our products and services. You may unsubscribe from these communications at any time. For information on how to unsubscribe, as well as our privacy practices and commitment to protecting your privacy, please review our Privacy Policy.
  • Contact
  • About
  • Help Center
  • Career Opportunities
  • Press Contact
  • User Agreement
  • Privacy Policy
  • Site Map

Additional Resources

  • Market Size Resources
  • Lawn & Garden Market Research
  • Roofing Market Research
  • Pet Products Market Research
  • Countertops Market Research
  • Power Tools Market Research
  • Publishing for the PreK-12 Market Research
  • Insulation Market Resaerch
  • Cabinets Market Research
  • Flooring Market Research
  • Pet Supplements Market Research
  • Agricultural Equipment Market Research
  • Open Access Publishing Market Research
  • Silicones Market Research
  • For Legal Inquiries, contact Cohen & Cohen
Copyright © 2025 The Freedonia Group, Inc. All rights reserved.