US Garage & Overhead Doors 2022
This report is part of a series of studies available on the window and door market and is targeted at customers with a specific interest in garage and overhead doors.

Free Sample Report
Request a free sample of this report and our team will email it to you.
Report Overview
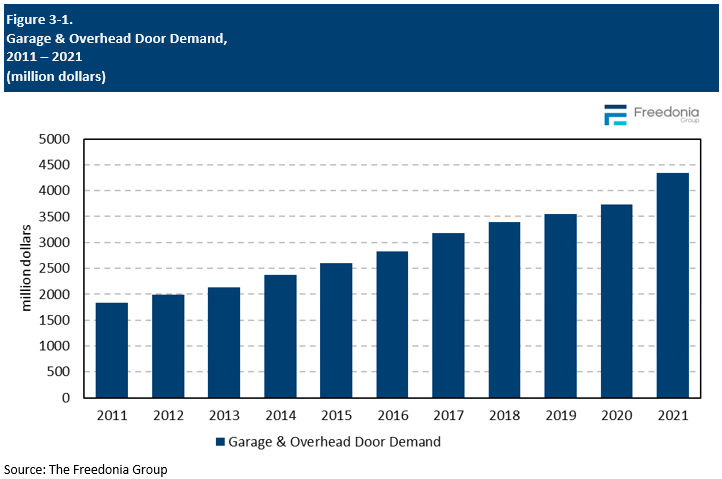
US demand for residential garage and commercial overhead doors is forecast to increase 1.1% per year to $4.6 billion in 2026, a significant deceleration from the 2016-2021 period. Market value growth will be restrained by a moderation in prices from high 2021 and 2022 levels that resulted from supply chain issues and price spikes for raw materials such as aluminum, steel, wood, and PVC.
Growth will primarily derive from healthy gains in unit terms, which will be supported by:- solid gains in commercial building construction and renovation activity
- ongoing spending to update garage and overhead doors with newer models that offer improved performance and/or aesthetic advantages
Featuring 34 tables and 12 figures – available in Excel and Powerpoint! Learn More
Homeowners Increasingly Seek Garage Doors with More Glass & Insulation
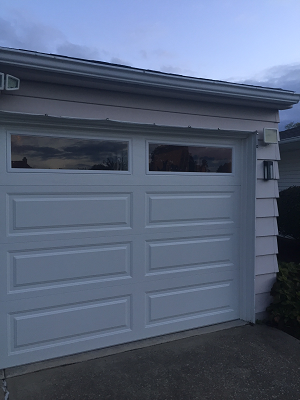
Garage door manufacturers are expanding their product offerings to include doors with more windows and window options, such as new designs and colors and larger glazed panels. Suppliers are responding to homeowners’ growing interest in garage doors that impart contemporary aesthetics while enhancing interior daylighting.
Other value-added features include enhanced durability, wind load resistance, and insulation. Many homeowners are upgrading to more energy-efficient insulated garage doors that can help lower utility bills. The growing trend of using garages as alternative exercise, storage, workshop, or office spaces has also boosted demand for doors that offer better temperature and sound insulation.
Growth Opportunities for Overhead Doors with Enhanced Durability & Fast Opening Speeds
Competitors in the commercial overhead door market are encouraging building owners to invest in doors that feature enhanced durability, security, and thermal insulation. Suppliers are also expanding overhead door style options, such as to include the aluminum-frame models with glass panels that see strong demand in eating and drinking establishments.
A small, but growing, segment of the overhead door market consists of industrial fabric and rubber doors that open and close at rapid speeds. The springless designs of these high-speed doors also reduce maintenance requirements and improve product lifespan.
This study analyzes US demand for garage and overhead doors by type (garage doors, overhead doors), material (metal, wood, vinyl and fiberglass), market (residential, commercial), application (new, replacement, and by major US region (Northeast, Midwest, South, West). Within each market, demand is presented by building type. Historical data (2011, 2016, and 2021) and forecasts for 2026 and 2031 are presented for garage and overhead door demand in current US dollars (including inflation) and in units.
Historical Market Trends
Sales of garage and overhead doors are impacted by general economic trends and the boom-and-bust nature of the US construction industry. Due to its cyclicality, spending on new building construction – and associated products – is typically more volatile than that in the replacement market.
Key factors impacting demand in the new construction market include:
-
trends in single-family construction activity, particularly in the replacement market
-
multifamily remodeling activity and the construction of new high-rises
-
commercial building construction
Prospects in the renovation market are impacted by a number of factors, including:
-
the current lending environment including interest rates and credit requirements
-
home values, which impact homeowner ability to get home equity loans to fund improvement projects
- changing consumer preferences regarding style or material
Demand by Product
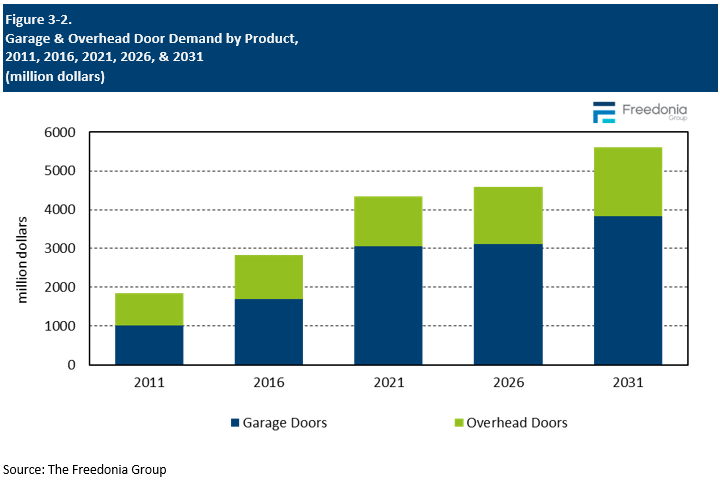
Product Outlook Demand for garage and overhead doors is expected to increase 1.1% per year to $4.6 billion in 2026, a significant deceleration from the 2016-2021 period when average prices soared due to supply constraints and inflation. Market value growth will be driven by increases in unit demand, which will be bolstered by:
-
solid gains in commercial building construction and renovation activity
-
ongoing spending to update garage and overhead doors with newer models that offer improved performance and/or aesthetic advantages
While garage doors account for the majority of demand, overhead doors are projected to grow at a faster rate due to an improvement in commercial building construction following declines during the pandemic.
Demand by Market
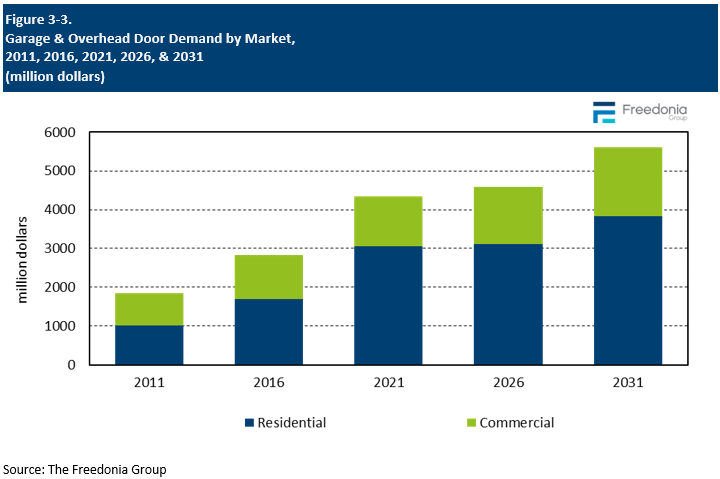
Demand Outlook Demand for garage and overhead doors is expected to increase 1.1% per year to $4.6 billion in 2026.
Residential garage doors will continue to account for the majority demand, a position supported by a number of factors including:
-
a wide variety of aesthetic and value-added features available for garage doors that boost average costs and support replacement to update a home’s appearance, security, and/or energy efficiency
-
the high costs of custom designed wood garage doors
-
more frequent replacement of garage doors, which are typically less durable than commercial overhead types
Demand for commercial overhead doors will be supported by:
-
healthy increases in construction spending for all commercial building types, especially in the large office, retail, and lodging and industrial markets
- ongoing efforts by commercial property owners to improve the security, appearance, and energy efficiency of their buildings to protect their assets, attract business, and reduce utility bills
- Executive Summary
- Figure 1-1. Garage & Overhead Door Market Outlook
- About This Report
- Report Details
- Study Scope & Product Description
- Short-Term Trends
- Table | Annual Garage & Overhead Door Demand by Product, 2019 – 2023 (million dollars & thousand units)
- Overview
- Historical Market Trends
- Table | Garage & Overhead Door Demand, 2011 – 2021 (million dollars & thousand units)
- Figure 3-1. Garage & Overhead Door Demand, 2011 – 2021 (million dollars)
- Demand by Product
- Product Outlook
- Table | Garage & Overhead Door Demand by Product, 2011, 2016, 2021, 2026, &2031 (million dollars & thousand
- Figure 3-2. Garage & Overhead Door Demand by Product, 2011, 2016, 2021, 2026, &2031 (million dollars
- Garage Doors
- Table | Garage Door Demand by Material, 2011, 2016, 2021, 2026, &2031 (million dollars & thousand units)
- Overhead Doors
- Table | Overhead Door Demand by Material, 2011, 2016, 2021, 2026, &2031 (million dollars & thousand units)
- Product Outlook
- Demand by Market
- Demand Outlook
- Table | Garage & Overhead Door Demand by Market, 2011, 2016, 2021, 2026, &2031 (million dollars & thousand u
- Figure 3-3. Garage & Overhead Door Demand by Market, 2011, 2016, 2021, 2026, &2031 (million dollars)
- Residential Buildings
- Table | Residential Garage Door Demand by Housing Type, 2011, 2016, 2021, 2026, &2031 (million dollars)
- Commercial Buildings
- Table | Commercial Overhead Door Demand by Building Type, 2011, 2016, 2021, 2026, &2031 (million dollars)
- Demand Outlook
- Demand by Application
- Table | Garage & Overhead Door Demand by Application, 2011, 2016, 2021, 2026, &2031 (million dollars & thous
- Figure 3-4. Garage & Overhead Door Demand by Application, 2011, 2016, 2021, 2026, &2031 (million dol
- Pricing Trends
- Table | Garage & Overhead Door Pricing by Material, 2011, 2016, 2021, 2026, &2031 (dollars per unit)
- Figure 3-5. Garage & Overhead Door Pricing Growth, 2011, 2016, 2021, 2026, &2031 (% CAGR)
- Historical Market Trends
- Factors Impacting Door Demand
- Construction Industry Outlook
- Figure 4-1. Building Construction Expenditures by Market, 2000 – 2026 (billion 2012 dollars)
- Building Codes
- Table | Selected International Building Code Updates
- Industry Standards & Specifications
- Green Building Certification Programs
- ICC Programs
- LEED
- Construction Industry Outlook
- Material
- Demand by Material
- Table | Garage & Overhead Door Demand by Material, 2011, 2016, 2021, 2026, &2031 (million dollars)
- Table | Comparison of Residential Garage Door Materials
- Metal Garage & Overhead Doors
- Table | Metal Garage & Overhead Door Demand by Product & Application, 2011, 2016, 2021, 2026, &2031 (million
- Figure 5-1. Metal Garage & Overhead Doors: Product Examples
- Wood Garage Doors
- Table | Wood Garage Door Demand by Application, 2011, 2016, 2021, 2026, &2031 (million dollars)
- Figure 5-2. Wood Garage Doors: Product Examples
- Vinyl & Fiberglass Garage & Overhead Doors
- Table | Vinyl & Fiberglass Garage & Overhead Door Demand by Product & Application, 2011, 2016, 2021, 2026, &
- Figure 5-3. Wood Garage & Overhead Doors: Product Examples
- Demand by Material
- Regions
- Demand by Region
- Table | Garage & Overhead Door Demand by Region, 2011, 2016, 2021, 2026, &2031 (million dollars)
- Northeast
- Table | Northeast: Garage & Overhead Door Demand by Product & Subregion, 2011, 2016, 2021, 2026, &2031 (mill
- Midwest
- Table | Midwest: Garage & Overhead Door Demand by Product & Subregion, 2011, 2016, 2021, 2026, &2031 (millio
- South
- Table | South: Garage & Overhead Door Demand by Product & Subregion, 2011, 2016, 2021, 2026, &2031 (million
- West
- Table | West: Garage & Overhead Door Demand by Product & Subregion, 2011, 2016, 2021, 2026, &2031 (million d
- Demand by Region
- Key Suppliers & Market Share
- Industry Composition
- Market Share
- Figure 7-1. Garage & Overhead Door Market Share by Company, 2021 (billion dollars)
- Appendix
- Scope
- Table | Relevant Industry Codes
- Table | Relevant HS Codes
- Definitions
- Freedonia Methodology
- Study-Specific Methodology
- Sources
- Related Studies & Reports
- Macroeconomic Assumptions
- Economic Environment
- Table | Macroeconomic Indicators, 2011, 2016, 2021, 2026, &2031 (billion 2012 dollars)
- Demographic Trends
- Table | Population & Households, 2011, 2016, 2021, 2026, &2031 (million persons)
- Consumer Spending
- Table | Personal Consumption Expenditures, 2011, 2016, 2021, 2026, &2031 (billion dollars)
- Consumer Financing
- Table | Consumer Financing Environment, 2011 – 2021
- Building Construction
- Table | Building Construction Expenditures, 2011, 2016, 2021, 2026, &2031 (billion dollars & billion 2012 do
- Residential Building Construction
- Table | Residential Building Construction Expenditures, 2011, 2016, 2021, 2026, &2031 (billion dollars & bil
- Residential Improvements & Repairs
- Table | Residential Improvement & Repair Expenditures, 2011, 2016, 2021, 2026, &2031 (billion dollars & bill
- Commercial Building Construction
- Table | Commercial Building Construction Expenditures, 2011, 2016, 2021, 2026, &2031 (billion dollars & bill
- Commercial Building Improvements & Repairs
- Table | Commercial Building Improvement & Repair Expenditures, 2011, 2016, 2021, 2026, &2031 (billion dollar
- Nonbuilding Construction Expenditures
- Table | Nonbuilding Construction Expenditures, 2011, 2016, 2021, 2026, &2031 (billion dollars & billion 2012
- Housing Completions
- Table | New Housing Indicators, 2011, 2016, 2021, 2026, &2031
- Figure 8-1. New Housing Square Footage by Housing Type, 2006 – 2021 (average square feet per unit)
- Economic Environment
- Scope