


Heating Equipment Market in the US by Product, Energy Source, Market and Region
US Sales of heating equipment are expected to slow from gains recorded during the 2011-2016 period, as during this earlier period there was a higher level of replacement sales to alleviate pent up demand.
Free Sample Report
Request a free sample of this report and our team will email it to you.
Report Overview
Replacement of Aging Equipment to Remain the Key Driver of Growth
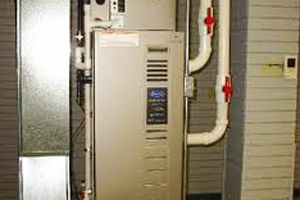
US Sales of heating equipment are expected to slow from gains recorded during the 2011-2016 period, as during this earlier period there was a higher level of replacement sales to alleviate pent up demand following the Great Recession. Replacement cycles are expected to normalize going forward, slowing the overall pace of growth.
Key Findings in the Heating Equipment Study:
Warm Air Furnaces to Continue its Market Dominance
Warm air furnaces, which comprised well over half of total heating equipment sales in 2016, will remain the most popular type of heating equipment in the US. Consumer preference for forced air heating will result in the equipment being utilized in most residential and commercial buildings.
Steel Boilers to Outpace All Other Product Types
Although boilers as a whole will continue to lose market share to other types of heating equipment due to ongoing weakness of cast iron types, demand for steel boilers will increase at a faster rate than any other product type. Much of this will be due to rising use of condensing boilers, which generally utilize steel heat exchangers and have a higher level of energy efficiency than non-condensing boilers.
Residential Market Sales will be Stronger Than in the Commercial Market
Continuing a recent trend, the residential market for heating equipment will expand faster than commercial product sales through 2021. Healthy increases in residential building construction spending will contribute to much of this growth. In addition, the average lifespan of residential heating equipment is typically lower than commercial equipment, resulting in a higher number of replacement sales opportunities.
Study Coverage
This industry study presents historical demand data (2006, 2011, and 2016) and forecasts (2021) by product (warm air furnace, boiler, and room and zone heating equipment), energy source (natural gas, electricity, and heating oil and other energy sources), market (commercial and residential), and US region (Midwest, South, Northeast, and West). Demand is presented in both dollars and units. The study also evaluates company market share and provides a competitive analysis of leading manufacturers, including AO Smith, Burnham Holdings, Daikin Industries, Ingersoll-Rand, Lennox, Melrose Industries, Mestek, Paloma, SPX, and United Technologies.
- EXECUTIVE SUMMARY
- Figure 1-1 | Key Trends in the US Market for Heating Equipment
- OVERVIEW
- Key Findings
- Figure 2-1 | Key Trends in the Heating Equipment Market
- Factors Influencing Heating Equipment Demand
- Climate Zones
- Energy Profile
- Table | Average Retail Energy Costs in the US by Source, 2006-2021
- Energy Efficiency
- Impact of Tax Credits on Heating Equipment Demand
- Pricing Trends
- Table | Heating Equipment Pricing Trends, 2006-2021
- Figure 2-2 | Heating Equipment Pricing Trends, 2006-2021
- Market Volatility
- Figure 2-3 | Heating Equipment Demand, 2006-2016
- Foreign Trade
- Table | Foreign Trade in Heating Equipment, 2006-2021
- Figure 2-4 | US Foreign Trade in Heating Equipment, 2006-2016
- Imports
- Table | Heating Equipment Imports by Source, 2006-2016
- Figure 2-5 | Heating Equipment Imports by Source, 2006-2016
- Exports
- Table | Heating Equipment Exports by Destination, 2006-2016
- Figure 2-6 | US Heating Equipment Exports by Destination, 2006-2016
- Key Findings
- PRODUCTS
- Key Findings
- Figure 3-1 | Key Trends in Heating Equipment Products
- Heating Equipment Historical Trends
- Heating Equipment Forecasts
- Table | Heating Equipment Supply & Demand, 2006-2021
- Figure 3-2 | Heating Equipment Demand, 2006-2021
- Heating Equipment Demand by Energy Source
- Table | Heating Equipment Demand by Energy Source, 2006-2021
- Figure 3-3 | Heating Equipment Demand by Energy Source, 2016
- Heating Equipment Demand by Product
- Table | Heating Equipment Demand by Value & Volume, 2006-2021
- Figure 3-4 | Heating Equipment Demand by Value & Volume, 2016
- Warm Air Furnace
- Table | Warm Air Furnace Supply & Demand, 2006-2021
- Figure 3-5 | Warm Air Furnace Demand, 2006-2016
- Table | Warm Air Furnace Demand by Energy Source, 2006-2021
- Figure 3-6 | Warm Air Furnace Demand by Energy Source, 2016
- Table | Natural Gas Warm Air Furnace Demand by Value & Volume, 2006-2021
- Table | Electric Warm Air Furnace Demand by Value & Volume, 2006-2021
- Table | Heating Oil & Other Energy Source Warm Air Furnace Demand by Value & Volume, 2006-2021
- Boilers
- Table | Boiler Supply & Demand, 2006-2021
- Figure 3-7 | Boiler Demand, 2006-2016
- Table | Boiler Demand by Type, 2006-2021
- Figure 3-8 | Boiler Demand by Product Type, 2016
- Table | Cast Iron Boiler Demand by Value & Volume, 2006-2021
- Table | Steel Boiler Demand by Value & Volume, 2006-2021
- Room & Zone Heating Equipment
- Table | Room & Zone Heating Equipment Supply & Demand, 2006-2021
- Figure 3-9 | Selected Commercial & Residential Building Applications for Room & Zone Heating Equipme
- Table | Room & Zone Heating Equipment Demand by Value & Volume, 2006-2021
- Key Findings
- MARKETS
- Key Findings
- Figure 4-1 | Key Trends in Heating Equipment Markets
- Heating Equipment Demand by Market
- Table | Heating Equipment Demand by Market & Segment, 2006-2021
- Figure 4-2 | Heating Equipment Demand by Market, 2006-2021
- Commercial
- Table | Commercial Heating Equipment Demand by Segment, 2006-2021
- Figure 4-3 | Commercial Heating Equipment Demand, 2006-2016
- Table | Commercial Heating Equipment Demand by Building Type, 2006-2021
- Figure 4-4 | Commercial Heating Equipment Demand by Building Type, 2016
- Table | Commercial Heating Equipment Demand by Product, 2006-2021
- Figure 4-5 | Commercial Heating Equipment Demand by Product, 2016
- Residential
- Table | Residential Heating Equipment Demand by Segment, 2006-2021
- Figure 4-6 | Heating Equipment Demand in Existing Residential Buildings by Value, 2006-2016
- Figure 4-7 | New Residential Building Heating Equipment Demand by Value, 2006-2016
- Table | Residential Heating Equipment Demand by Building Type, 2006-2021
- Figure 4-8 | Residential Heating Equipment Demand by Building Type, 2016
- Table | Residential Heating Equipment Demand by Product, 2006-2021
- Figure 4-9 | Residential Heating Equipment Demand by Product, 2016
- Key Findings
- REGIONS
- Key Findings
- Figure 5-1 | Key Trends in Heating Equipment Demand by Region
- Climatic Factors Influencing Heating Equipment Demand
- Figure 5-2 | US Heating Equipment Demand Relative to Construction Spending by Region, 2016
- Heating Equipment Demand by Region
- Table | Heating Equipment Demand by Region, 2006-2021
- Figure 5-3 | Heating Equipment Demand by Region, 2016
- Northeast
- Table | Northeast: Heating Equipment Demand by Market, 2006-2021
- Table | Northeast: Heating Equipment Demand by Product, 2006-2021
- Figure 5-4 | Northeast: Heating Equipment Demand by Product, 2016
- Midwest
- Table | Midwest: Heating Equipment Demand by Market, 2006-2021
- Table | Midwest: Heating Equipment Demand by Product, 2006-2021
- Figure 5-5 | Midwest: Heating Equipment Demand by Product, 2016
- South
- Table | South: Heating Equipment Demand by Market, 2006-2021
- Table | South: Heating Equipment Demand by Product, 2006-2021
- Figure 5-6 | South: Heating Equipment Demand by Product, 2016
- West
- Table | West: Heating Equipment Demand by Market, 2006-2021
- Table | West: Heating Equipment Demand by Product, 2006-2021
- Figure 5-7 | West: Heating Equipment Demand by Product, 2016
- Key Findings
- INDUSTRY STRUCTURE
- Key Findings
- Industry Composition
- Table | Heating Equipment Sales by Company, 2016
- Market Share
- Figure 6-1 | US Heating Equipment Market Share, 2016
- Figure 6-2 | Heating Equipment: Overall Leading Supplier
- Figure 6-3 | Heating Equipment: Second Leading Supplier
- Figure 6-4 | Heating Equipment: Third Leading Supplier
- Figure 6-5 | Heating Equipment: Fourth Leading Supplier
- Competitive Strategies
- Product Development & Manufacturing
- Table | Selected High Efficiency Heating Equipment by Company
- Table | R&D Spending for Selected Heating Equipment Companies, 2016
- Marketing
- Distribution
- Cooperative Agreements
- Table | Selected Cooperative Agreements
- Mergers, Acquisitions, &Industry Restructuring
- Table | Selected Acquisitions & Divestitures
- List of Industry Participants
- APPENDIX
- Scope
- Table | Study Scope: Heating Equipment Markets
- Table | Study Scope: US Regions
- Table | Relevant NAICS Codes
- Methodology
- Sources
- Associations & Agencies
- Related Freedonia Group Studies
- Definitions
- Abbreviations
- Table | Abbreviations & Acronyms Used in Study
- Climate Zones
- Figure 7-1 | Continental US Climate Zones*
- Macroeconomic Assumptions
- Economic Environment
- Table | Macroeconomic Indicators, 2006 - 2021
- Figure 7-2 | Annual Growth in Real GDP, 2000 - 2016, Compared to 1980 - 2005 Average
- Demographic Trends
- Table | Population & Households, 2006 - 2021
- Figure 7-3 | Annual Population Growth, 2001 - 2016
- Consumer Trends
- Table | Personal Consumption Expenditures, 2006 - 2021
- Building Construction
- Table | Building Construction Expenditures, 2006 - 2021
- Residential
- Table | Residential Building Construction Expenditures, 2006 - 2021
- Table | New Housing Indicators, 2006 - 2021
- Table | Housing Stock by Type, 2006 - 2021
- Figure 7-4 | Housing Stock by Year of Construction, 2016
- Table | Residential Improvement & Repair Expenditures, 2006 - 2021
- Nonresidential
- Table | Nonresidential Building Construction Expenditures, 2006 - 2021
- Economic Environment
- Scope
Related Reports
Global Material Handling Equipment Market Share

Global Packaging Machinery Market Share