Report Overview
 What’s Next in the DIY or DIFM Shift When it Comes to Lawn & Garden Activities?
-
Dual challenges exist as suppliers of lawn and garden consumables seek to retain and encourage pandemic era gardeners, but also support landscapers as DIFM is on the rise once again.
Sales of lawn and garden consumables are expected to grow 2.0% per year through 2027 to $12.3 billion. The forecast period will present several challenges, from near-term restraint in homeownership growth to longer-term issues such as climate change. However, it will also be a time of opportunity for retaining gardeners who began in the pandemic era and ushering them into more frequent or challenging activities that require more volume or greater variety of consumables, including higher value specialty products.
Featuring 123 tables and 58 figures – available in Excel and Powerpoint! Learn More
See Jennifer Christ's blog on the Evolving Retail Landscape
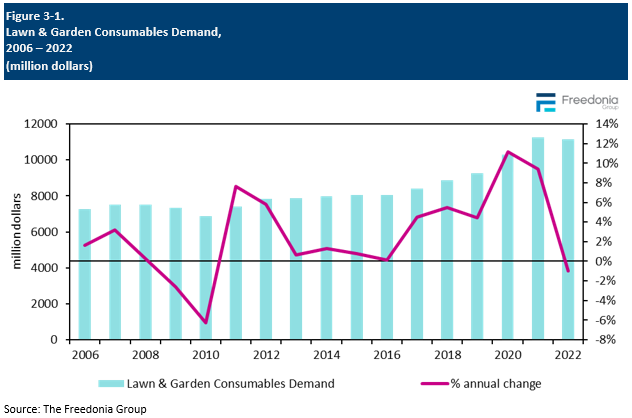
The market for lawn and garden consumables – including packaged fertilizer, pesticides, growing media, seeds, mulch, and niche products – reached $11.2 billion in 2022, slightly lower than 2021’s peak levels. The volatility of the recent past – which stemmed from factors such as COVID-era spikes in gardening participation, supply chain challenges, destocking, and inflation – largely played out through 2023, setting the table for a new era with other shifts through the coming years.
Gains Across Segments in Professional User Market Due to DIY to DIFM Shift
Professional end users are expected to post faster growth compared to consumer end users, even in the large residential market, reflecting the ongoing shift of some lawn and garden care activities from do-it-yourself (DIY) to do-it-for-me (DIFM). Opportunities exist among the landscaping segment to increase services to home markets, and there is potential for monetary growth as landscapers step up to value-added sustainable options and use more packaged products to save on labor costs.
Another segment of professional users that benefit from increased gardening in the residential market are the growers who supply seedlings, sod, and full plants to the consumer segment – whether the plants are part of an outdoor garden (in a yard, raised beds, or community space) or potted.
Value & Volume Trends Paint a Different Picture at the Product Level
Fertilizers will remain the largest segment in value terms, but pesticides will account for the most value growth through 2027. This is largely attributable to pricing and innovations that shift demand to higher value options. However, both have the opportunity to add volume; this is particularly true of combination products or natural versions that are formulated with safer or more sustainable ingredients.
Lower-cost products account for a large share of sales when looking at trends by volume . Growing media remains the largest segment by product weight, while mulch will account for 38% of total lawn and garden consumables volume gains through 2027. Still, value growth opportunities exist for both because of innovations with value-added components, specialty versions, and improved performance via additional functional elements.
Historical Market Patterns
Overall, yearly demand fluctuations in lawn and garden consumables are influenced by many factors, including:
-
residential and commercial construction, which generally involves the installation of new lawns and landscaping
-
trends in average lot size and maintained areas
-
personal incomes and levels of discretionary spending
-
the number of people participating in gardening as a hobby
-
variability in active ingredient and raw material pricing and availability
-
weather patterns and climate change
-
a shift in product mix favoring either economy or value-added formulations
-
changes in the way living spaces are used and the frequency with which they are used
Weather and climate change play a continuing role in the variability of demand for these products. Abnormal storms or longer terms events like droughts can influence the need or replacement for certain types of products. Additionally, as climates change over time, regions will see more variations in the lawn and garden consumables they require.
Demand for lawn and garden consumables surged in 2020 and 2021 because of increased investment in outdoor projects, particularly on the residential side. However, consumers had returned to many of their pre-pandemic leisure habits by 2022, leading some to scale back from their own lawn and garden activities and reduce spending on consumables. That served as a boost for professional landscapers, as some consumers shifted back to spending on their services; although, in many segments, gains came in value terms because price increases helped to reduce the impact of declining volumes. On balance, the result was a net dip in spending on total lawn and garden consumables.
Packaged vs. Bulk Sales
Some lawn and garden consumables are sold in both bulk and packaged formats. Bulk products are purchased mostly by commercial end users, but consumers who have large properties or extensive projects may also purchase in bulk.
Packaged products account for 70% of lawn and garden consumables, although this can vary by year due to changes in the types of buildings being constructed (and landscaping required), weather, and consumer spending trends.
Packaged products face the most competition from bulk purchases in soil, mulch, and fertilizer and mostly in the commercial market:
-
The packaged consumables sector will account for a larger share of gains because of increasing interest in value-added products and premixed formulations – both of which are generally sold packaged.
-
Bulk suppliers will continue to benefit from lower unit prices, the convenience of delivery for heavy products, and closer local relationships.
Generally speaking, users who purchase packaged soil and mulch tend to engage in smaller-scale lawn and landscaping projects, and often emphasize the ease of handling packaged products over having to deal with less expensive bulk soil and mulch, which can be both messy and unwieldy when delivered to a home’s driveway or lawn.
Professional users are more likely to turn to bulk lawn and garden products, primarily for the cost-saving benefits. Additionally, professional users are less likely to be reliant on products such as pre-mixed soil blends, and often instead prefer to use their own expertise to select the products they need. Still, some professional landscapers appreciate the convenience of dropping easier-to-carry, ready-to-use packaged products around a job site over customizing mixes and having to move bulk amounts in wheelbarrows (or other vessels). This is particularly important because many landscapers are having difficulty staffing their contracted jobs.
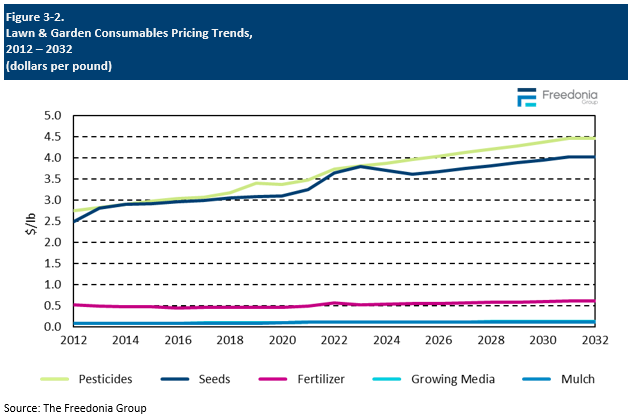
Pricing Trends
There is wide variation in the prices for lawn and garden consumables. Many of these products are relatively inexpensive due to their basic, undifferentiated nature and the fact that some products are made with waste materials that would otherwise be discarded, such as mulches and soil amendments:
-
Pesticides generally carry the highest prices due to their specialized nature; they are typically used in smaller amounts for specific applications, and often enjoy some type of patent protection or limited market competition.
-
The pesticide products in the lawn and garden market sold in the largest volumes are relatively inexpensive. Still, some herbicides and most insecticide active ingredients are considerably more costly, contributing to price differences within the total category.
-
Commodities – such as soil, compost, mulch, and peat – generally cost pennies per pound.
-
Fertilizers are also relatively inexpensive materials due to market maturity, significant economies of scale, and strong industry competition.
Factors impacting lawn and garden consumable pricing overall include:
-
levels of patent protection
-
new product introductions and product innovation
-
raw material and commodity costs
-
energy costs in manufacturing
-
tariffs and currency fluctuations
-
supply chain challenges and transportation costs
The average price for all lawn and garden consumables is expected to increase less than 1.0% per year through 2027, with several categories (or product types within those categories) seeing short-term declines before returning to positive status by 2027; those losses will essentially be corrections from the elevated levels of 2022 and 2023. Otherwise, growth through the rest of the forecast period will reflect product trends that boosted prices over the preceding decade:
-
Pesticide use will remain dominated by off-patent products, so future price growth will result from higher-value formulations rather than a significant shift in active ingredients.
-
Pricing for seeds will be influenced by specialty plant varieties becoming more readily available to lawn and garden users.
-
While average prices for growing media will remain flat, some product types within the category will see gains based on an increasing number of higher-value entries on the market.
About This Study
This Freedonia industry study analyzes the $11.2 billion US packaged lawn and garden consumables industry. It presents historical demand data (2012, 2017, and 2022), forecasts (2027 and 2032), and annual historical and forecast data from 2019 to 2026 by product (fertilizers, pesticides, growing media, seeds, and mulch and other ground coverings), application (lawn and turf, gardens and borders, and other applications), market (residential, golf courses, government and institutional, and commercial and industrial), and end user (consumer, service firms, and other professional users). The study includes consumer insights data and analysis. It also evaluates company market share and competitive analysis on industry competitors including Bayer, Central Garden & Pet, Corteva, CRH, Envu, Nutrien, Scotts Miracle-Gro, Sinochem Holdings, and Spectrum Brands.