Report Overview
Durability and ease of use have become the most important influencers of consumer purchases:
-
Commercial-grade and higher quality hoses
-
Lightweight and flexible hoses
-
Enhanced nozzles
This Freedonia industry study analyzes the $1.3 billion US consumer lawn and garden watering  products industry. It presents historical demand data (2012, 2017 and 2022) and forecasts (2027) by product category and type (hoses – conventional, soaker/sprinkler, next generation lightweight; DIY irrigation systems – controllers, all other; nozzles – pattern, pistol, wands, all other; sprinklers – oscillating, pulsating/impact, stationary/spot, all other; hose reels; accessories and other products – tap timers, rain barrels, all other), and retail channel (home centers, discount stores, hardware stores, lawn and garden specialty stores, and others, including e-commerce). The study also evaluates company market share and competitive analysis on industry competitors including Husqvarna Group (through the acquisition of Orbit Irrigation), Teknor Apex, Swan Products, Lawn & Garden (acquired Fiskars watering business), Flexon Industries (US Wire & Cable), Melnor, and Rain Bird.
Featuring 38 tables and 61 figures – available in Excel and Powerpoint! Learn More
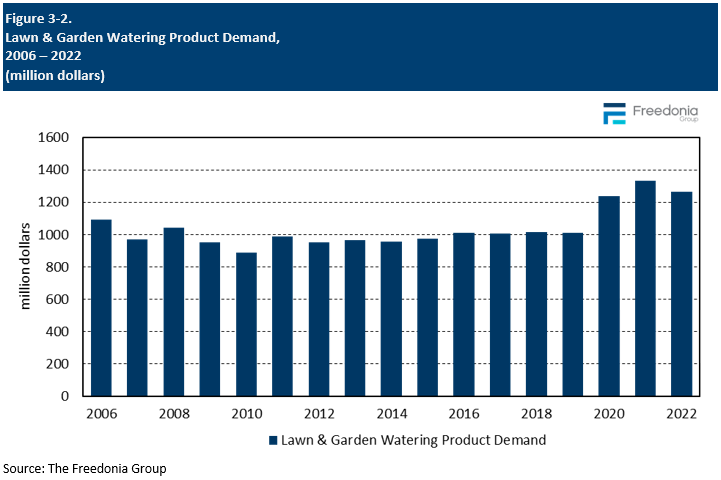
Demand for lawn and garden watering products is forecast to increase nearly 1.0% annually to $1.3 billion in 2027. With renewed interest in lawn care, more time spent at home, and excess dollars to spend, consumers bought unprecedented amounts of watering products in 2020 and 2021. While demand in unit terms has declined since this pandemic-related surge, it should revert to more historical, pre-pandemic levels by the end of the forecast period. Watering products sales will be sustained by:
- continued consumer preference for lush, green lawns and beautiful gardens
- significant participation in outdoor living
- elevated interest in both decorative and edible gardening
Durability & Ease-of-Use Key Consumer Purchase Drivers
Watering products are commodities that consumers generally buy based on functionality and price, yet two attributes are the most important influencers of consumer purchase:
- Durability of garden hoses and other watering products has surged as a major consumer point of interest. Many users are frustrated by expandable hoses that burst, conventional hoses that kink and tear, hose reels that leak, nozzles that break, and other functional breakdowns. Marketers have innovated various ways to improve product durability.
- Ease of use is important, and reflects both an aging consumer base and the general frustrations that people have with the weight and handling difficulty of most hoses. Marketers have responded with expandable and other lightweight versions, while nozzle manufacturers have been especially active in incorporating ergonomic features that increase handling comfort.
E-Commerce Grows Fastest; Home Centers Still Control More than Half of Total Sales
E-commerce grew much faster than other channels over the last 10 years, and it will continue to grow at the fastest rate through 2027. Some watering products – like hose reels and DIY irrigation systems – sell particularly well online; others (like hoses) do not, primarily because consumers cannot handle and/or examine them.
Home centers will still account for more than 50% of total watering product sales in 2027, largely because they benefit from significant national presences and generally have the most extensive product selections coupled with low prices.
Historical Market Trends
Lawn and garden watering products include garden hoses, hose reels, hose-end nozzles and sprinklers, DIY irrigation systems, tap timers, and accessories. Product trends in the US market primarily involve functionality and performance, durability, ease-of-use and convenience, and price to meet individual needs.
The watering products industry is relatively mature, highly dependent on weather, and highly seasonal, with 85% of sales occurring between April and August. Thus product demand can fluctuate significantly depending on weather conditions during those months. If the weather remains too dry or too rainy, watering product sales decline.
Weather has generally has been unkind to the industry throughout the last decade, with conditions impacting watering products sales at various times. Severe drought conditions and resulting water restrictions affected and still affect regions of the country while overly rainy springs in some years affected certain regions. Demand for DIY irrigation systems and hose-end sprinklers tend to suffer most when weather is unfavorable. Other products like drip irrigation systems, soaker hoses, and smart controllers benefit due to their ability to help conserve water.
Watering product demand is also a reflection of growth in the overall economy, and relies on multiple key factors, including:
- household formations
- home sales and new housing construction
- consumer spending levels
- exchange rates and price levels which impact demand as measured in US dollar terms
Indicators can be volatile (except for household formations), which along with weather, can produce annual swings in demand. However the pandemic-related demand spike in 2020 and 2021 was extraordinary and virtually impossible to predict.
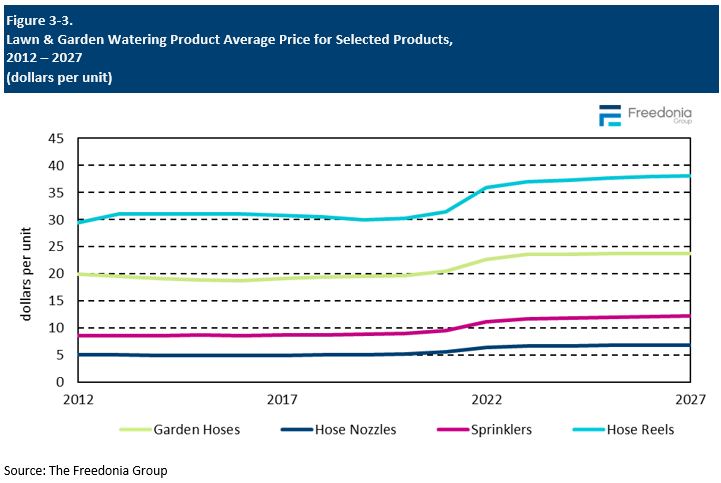
Pricing Trends
Lawn and garden watering product prices fluctuate across product categories, ranging from a few dollars for certain accessories to hundreds of dollars for DIY irrigation items.
Virtually every segment of the watering product industry is subject to similar pricing pressures. The most important of these include:
- the buying power of larger retailers
- shifts in raw material prices
- cost of transportation
Competition from low-cost imports is not as big a factor as in some industries since most hoses are manufactured in the US. However many expandable hoses are made overseas as are many nozzles and sprinklers. This has helped drive prices lower in the past.
Large retailers such as Home Depot, Lowe’s, and Walmart exert significant pricing pressure on manufacturers due to their high volume of watering product sales and the power it gives them to dictate pricing levels. While private label brands – typically lower priced than national brands – are not as strong as in other industries, their presence at some retailers keeps prices in check.
Among lawn and garden watering products:
- Hose-end nozzles are commodity products and subject to pricing pressure. Average nozzle retail prices are less than $15. Hose-end sprinklers are also fairly commoditized, with average retail prices a bit over $20.
- Hose reel prices are somewhat less pressured as there are a limited number of key players.
- DIY irrigation systems consist of more specialized components, so there is less pressure on prices. However, there are four relatively strong players in the market, so competition does keep prices competitive.