

US Plumbing Fixtures & Fittings Report
This study analyzes US demand for plumbing fixtures and fittings by product type, material (for fixtures), market, and region and subregion.

Free Sample Report
Request a free sample of this report and our team will email it to you.
Report Overview
Plumbing Fixtures in Demand: The Impact of Renovations, Water Efficiency, and Smart Technology on the Market's Future
Key Themes Covered in this Report:
- Rising demand for water-efficient, eco-friendly, and smart plumbing fixtures, driven by concerns over water scarcity, sustainability trends, and the growing adoption of smart home technologies.
- Increasing interest in touchless and hygienic plumbing products due to heightened sanitation awareness, particularly in both residential and commercial spaces.
- Opportunities from aging infrastructure replacement, renovation projects, and luxury upgrades, alongside a growing e-commerce shift and consumer preference for customized plumbing solutions.
- Regulatory pressures and advancements in material innovation are driving product development, with a focus on durability, sustainability, and compliance with water and energy-efficiency standards.
Featuring 97 Tables & 63 Figures!
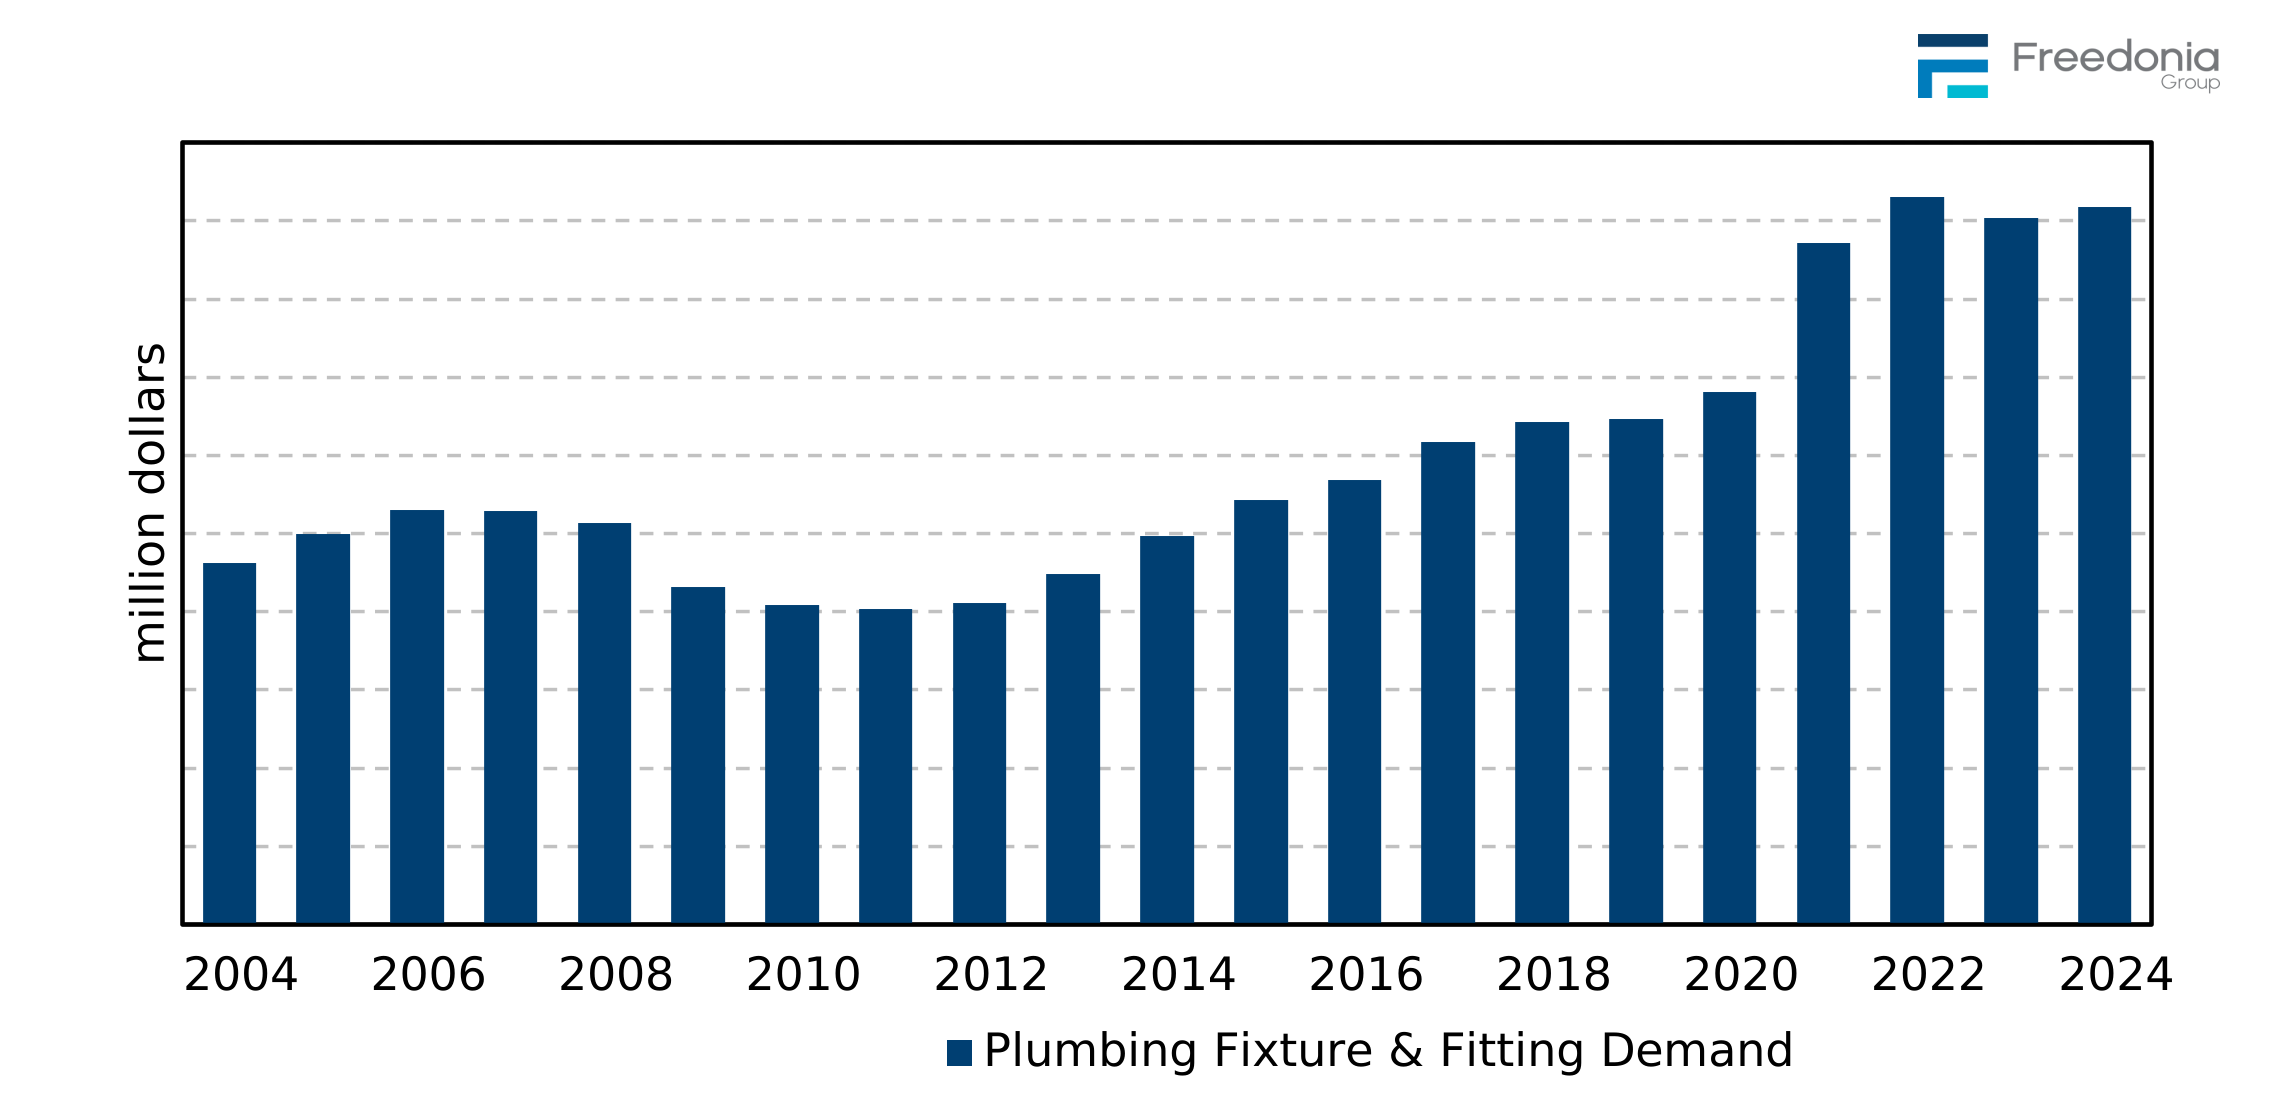
The US market for plumbing fixtures and fittings totaled $18.4 billion in 2024. Demand for these plumbing products is expected to grow 2.3% annually to $20.6 billion in 2029. In addition to traditional demand drivers (e.g., new construction and remodeling activity), market advances will be supported by several key trends, including:
- continued growth in the size and complexity of kitchen and bathroom spaces
- new product developments that are aimed at improving sustainability, water efficiency, and smart home integration while reducing installation labor requirements to control costs and offset labor shortages
- new product designs that meet the needs of specific market sectors, such as aging in place or multifamily housing
Larger Upgraded Kitchens & Baths Drive Demand for Higher Value Plumbing
Expanding and more personalized home designs – including butler’s pantries, dirty kitchens, and spa-like bathrooms – are increasing both the number and value of fixtures and fittings installed in residential buildings. Homeowners are prioritizing premium and highly functional products with advanced features, durable materials, and aesthetic appeal, thereby boosting demand for higher value sinks, faucets, tubs, and shower systems.
Innovation is Key to Meeting Sustainability, Installation, & Performance Challenges
The plumbing industry is responding to market pressures by developing water-efficient fixtures to meet new regulations, easy-installation products for labor-constrained markets, and advanced designs that offer both durability and performance. New product development (e.g., smart plumbing, tool-free fittings, modular plumbing systems, and customized designs) are reshaping offerings to address cost, efficiency, performance, design, ease-of-use, and regulatory requirements.
Smart Plumbing to Gain Momentum as Connectivity Becomes a Market Differentiator
The development of smart plumbing technology – including automated shut-off valves, touchless or voice-activated operation, leak detection, customizable settings, remote controls, and water usage monitoring – is becoming a critical competitive advantage in the plumbing industry. Smart solutions improve efficiency, reduce water waste, and decrease the risk of damage from leaks while offering convenience and flexibility to end users. As smart plumbing adoption grows, it will provide all these advantages and potentially lower operating costs, in addition to helping building owners meet new water regulation standards.
Historical Market Trends & Growth Factors
The market for plumbing fixtures and fittings can be volatile due to cyclicality in the underlying new construction market. However, this is offset to some degree by more stable demand for replacement fixtures and fittings as these items are replaced due to age, wear or remodeling activity.
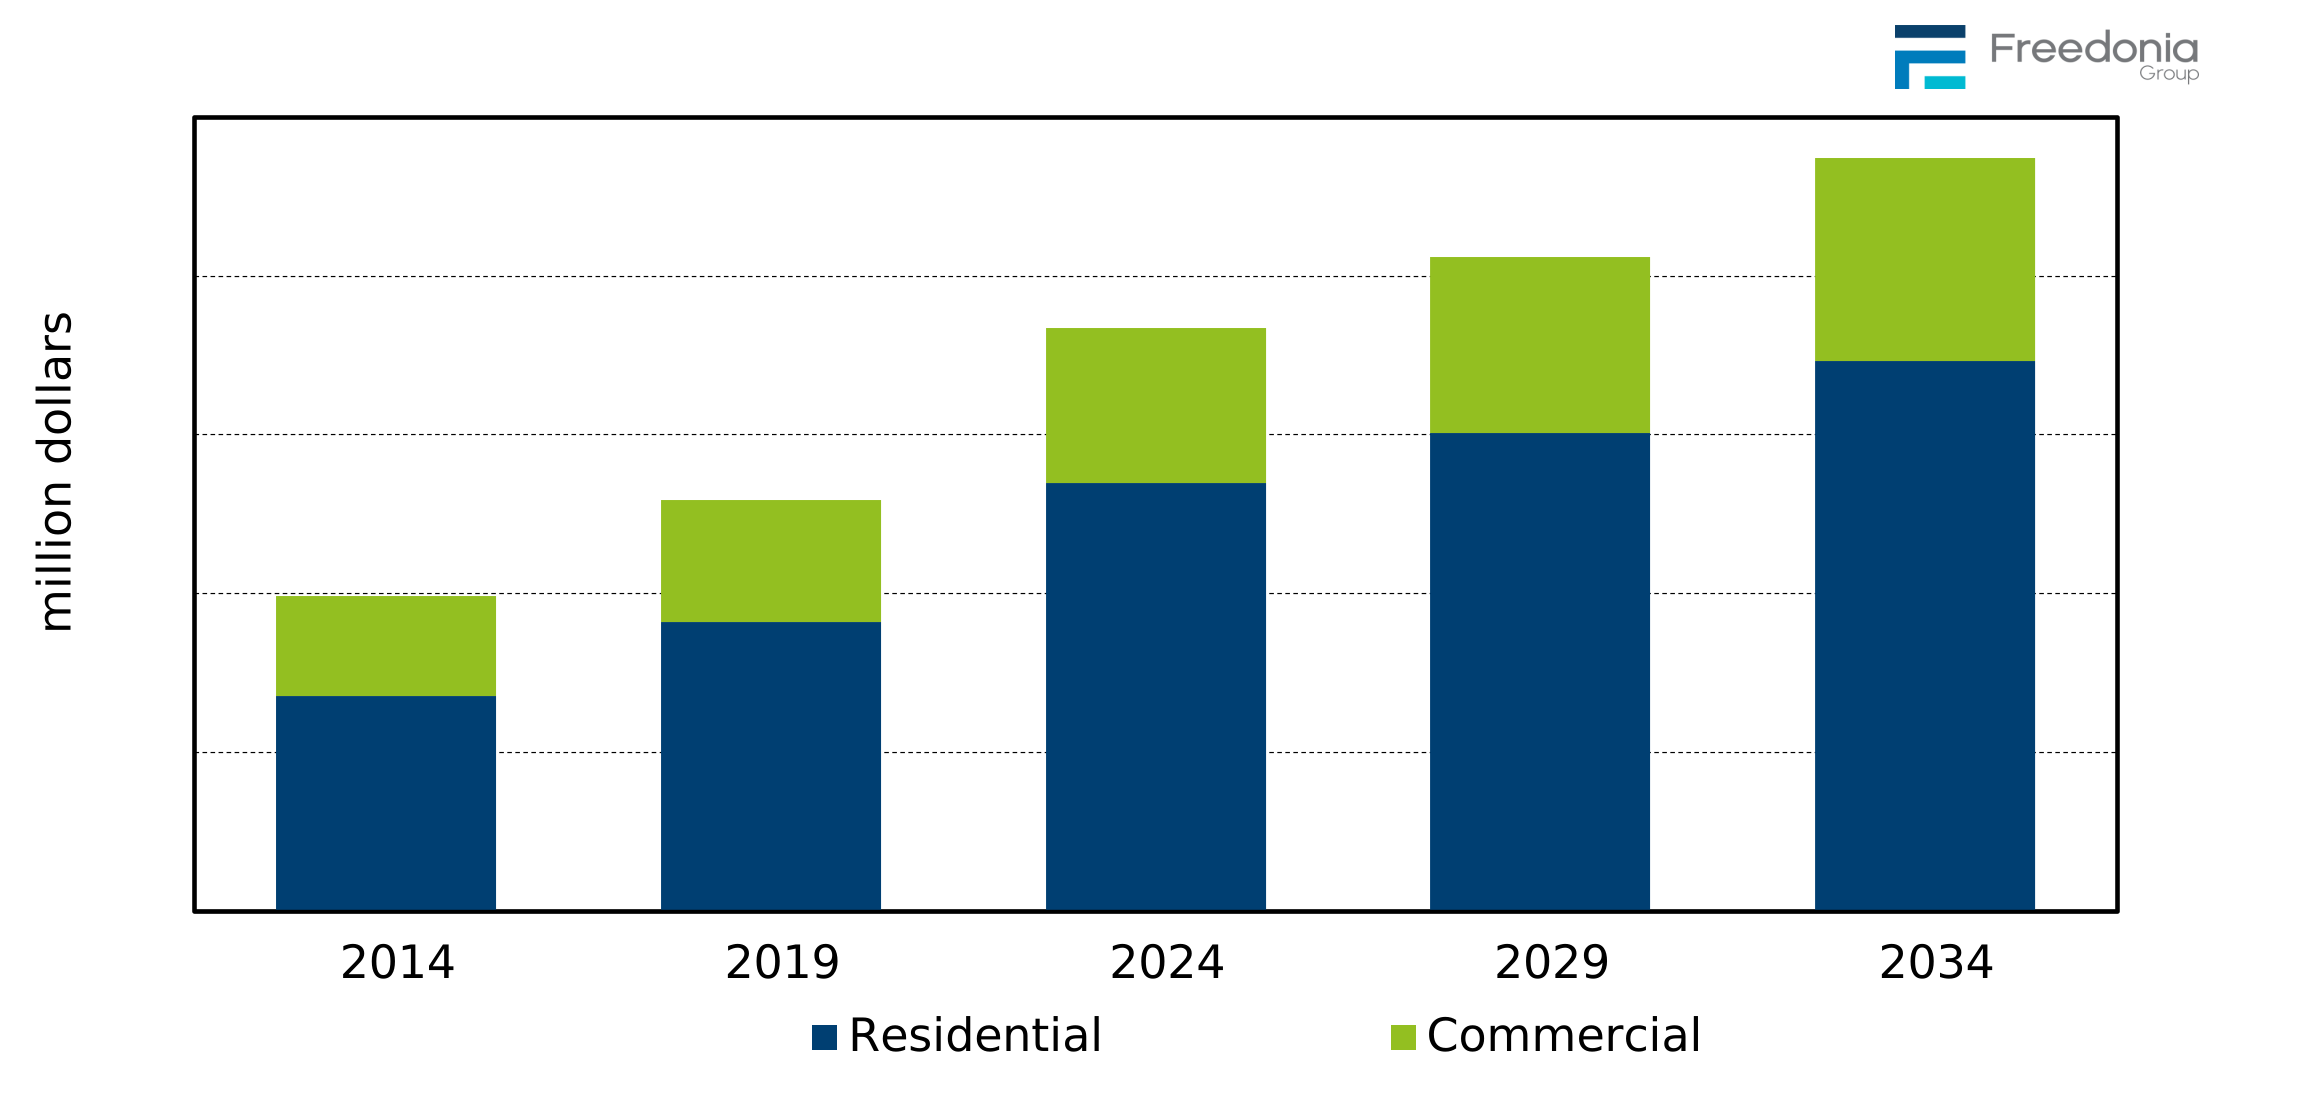
The residential market accounts for a larger share of demand than the commercial market, so changes in the number of new houses built and levels of residential improvement and repair activity play a more important role in determining overall demand for plumbing fixtures and fittings each year.
Demand for plumbing fixtures and fittings in the US is influenced by a variety of factors tied to general economic growth, construction activity, renovation trends, kitchen and bath design trends, and broader market dynamics (in both residential and commercial sectors).
-
Economic conditions have a strong impact on both new construction activity and the home renovation projects that might require replacement of plumbing products in both residential and commercial settings.
-
Greater consumer confidence and higher disposable incomes encourage new home purchases, renovations, and plumbing upgrades. They also increase sales of high-end or luxury plumbing products, which are chosen for aesthetic appeal or advanced features (but priced significantly higher than standard products). On the other hand, economic downturns can lead to deferred maintenance and reduced spending on non-essential improvements, including plumbing replacement.
-
In the commercial market, the health of the economy influences business expansion and commercial real estate development. A strong economy encourages investment in new facilities and upgrades to existing buildings, both of which increase demand for plumbing products.
-
-
New residential and commercial construction directly drives demand for plumbing fixtures and fittings, which are considered essential in most buildings.
-
Building renovation and remodeling levels provides more stable demand for plumbing fixtures and fittings; home renovations, including kitchen and bathroom upgrades, are especially important drivers of demand.
In addition to trends in the overall economy and construction activity, other factors impact both the number and type of plumbing fixtures and fittings purchased:
-
Regulations, local building codes, and government programs can impact demand for some products. For example, incentives that promote water-saving technologies can boost demand for compliant low-flow faucets, showerheads, and toilets.
-
Technological advancements, such as smart plumbing systems and touchless fixtures, can promote replacement demand and boost market value.
-
Health and hygiene concerns can increase purchases of touchless fixtures and advanced filtration systems, especially in commercial settings.
-
Weather patterns and water availability affect preferences for specific plumbing products, such as frost-resistant fittings in colder climates.
-
Trends in kitchen and bathroom design, including changes in the average numbers of these rooms per building, can significantly impact the industry. Changes in the number of bathrooms per building or the number of sinks in kitchen areas impacts demand for both fixtures and related plumbing products. Upgrades that require new plumbing to existing kitchens or bathrooms can also boost demand.
Supply & Demand
Demand Outlook
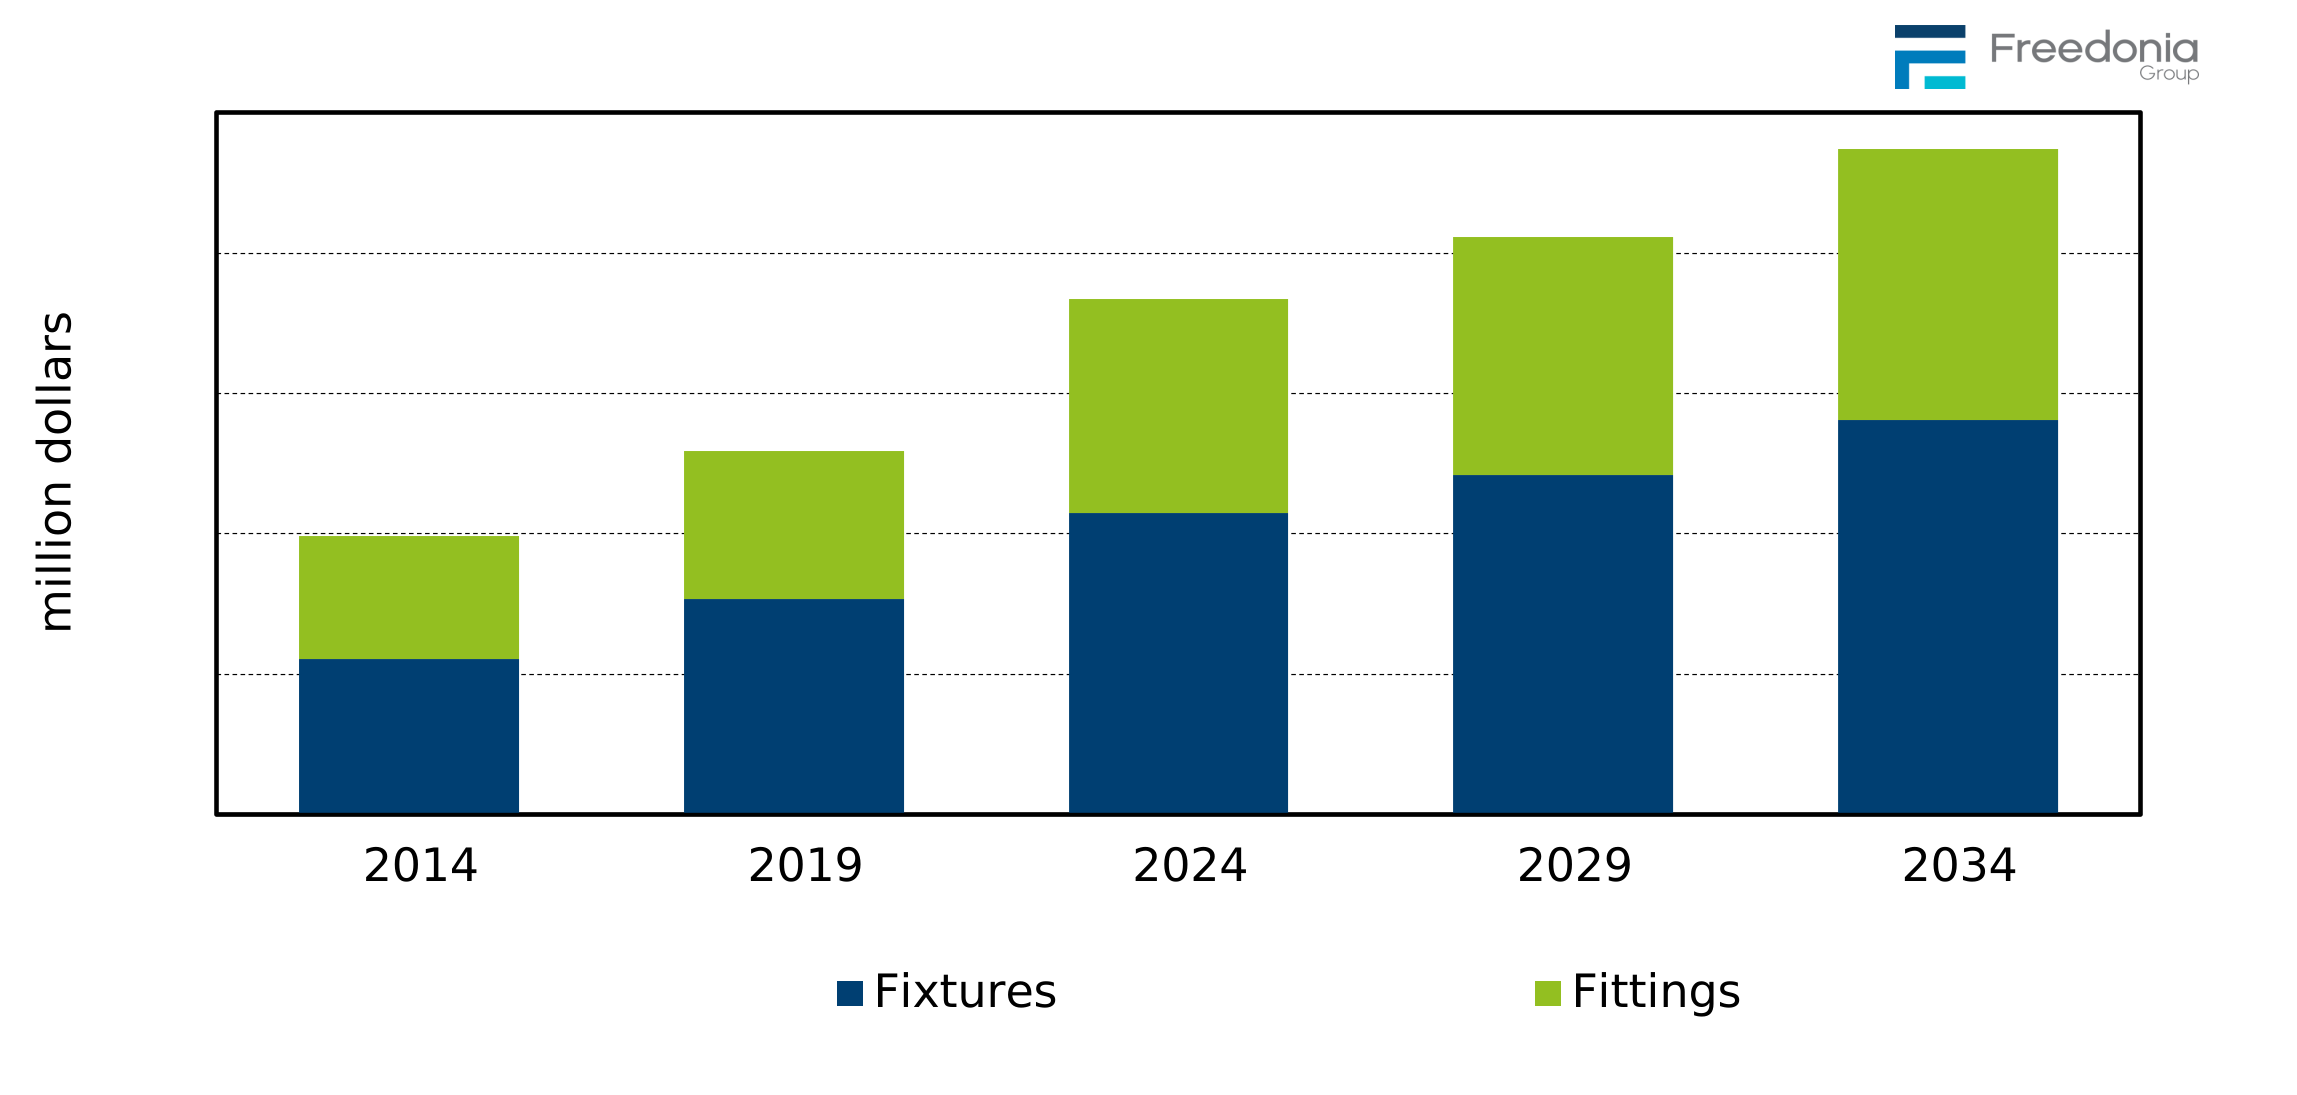
Demand for plumbing fixtures and fittings in the US is forecast to advance 2.3% annually to $20.6 billion in 2029. This represents a deceleration from the 2019-2024 period, when pandemic-related price surges in 2021 and 2022 caused market value to grow rapidly. Going forward, gains will be supported by:
-
design trends that call for homes and many commercial structures to have more and larger bathrooms
-
heightened interest in installing plumbing products that lower water consumption, as these products are generally sold at higher price points
Plumbing fixtures will remain the larger segment, with sales being boosted by:
-
the increasing number of fixtures in residences as homeowners add showers, lavatories, and prep sinks to their homes to enhance convenience
-
rising use of more visually appealing products – such as farmhouse sinks and cast-iron bathtubs – that are higher value, which add to homes’ aesthetics and values
-
increasing construction of bathroom-intensive commercial structures – such as hospitals, senior living facilities, and hotels – which increases demand for toilet and sink fixtures
Demand for plumbing fittings will be supported by:
-
increasing plumbing fixture unit demand, as most fixtures are outfitted with multiple fittings to connect them to water distribution and waste lines
-
rising interest in installing fittings that reduce water consumption, such as low-flow showerheads and toilet flush valves
However, demand and market value for fittings will remain lower than fixtures due to:
-
the generally lower prices per unit for plumbing fittings compared to plumbing fixtures
-
the durable nature of most metal plumbing fittings limiting replacement demand
Markets Overview
Plumbing fixtures and fittings are used primarily in buildings, although there are some applications in transportation equipment such as airplanes, boats, and recreational vehicles (all of which are excluded from the scope of this report). Key building market segments are:
-
new residential buildings
-
residential improvement and repair
-
new commercial buildings
-
commercial improvement and repair
The residential market is further segmented by housing type (single-family, multifamily, and manufactured housing), while the commercial market is segmented by building type (office, retail, and lodging; institutional; and industrial and other commercial buildings).
The residential market accounts for the largest share of US plumbing fixtures and fitting demand because of the:
-
large number of residential structures erected in any given year
-
numerous plumbing fixtures and fittings required to outfit a single-family home
-
continuing popularity of kitchen and bathroom renovation projects among homeowners
Residential demand for plumbing fixtures and fittings is anticipated to rise, supported by:
-
an increase in single-family housing completions
-
a high level of homeowner interest in renovating and expanding kitchens and adding and renovating bathrooms
-
increasing use of plumbing fixtures and fittings that can facilitate aging in place, as these products are often sold at higher price points than standard plumbing fixtures and fittings
Plumbing fixture and fitting demand in the commercial market is projected to rise, supported by:
-
greater construction of commercial buildings, including hotels, retail, and institutional buildings
-
efforts by building owners and managers to improve the functionality and convenience of their structures by adding more and larger bathrooms
US Plumbing Fixtures & Fittings Report Details
| Current Total Market Size | $18.4 billion |
| Forecast Total Market Growth Rate | 2.3% CAGR from 2024-2029 |
| Historical Period | 2014-2024 |
| Forecast Period | 2024-2034 |
| Units Covered | Dollars for fixtures and fittings; units for fixtures |
| Regions | US |
| Products | Fixtures and fittings |
| Product Types | bathtub and shower fixtures, sink fixtures, toilet fixtures, hot tubs and spas, bottle filling stations, bathroom sink fittings, bathtub and shower fittings, kitchen sink fittings, and all other fixtures and fittings |
| Markets | Residential and commercial |
| Fixture Materials | Plastic, metal, porcelain, cast polymer, fiberglass, all other fixture materials |
| Point Where Data is Measured | Manufacturer’s Level |
Key Industry Participants Driving Trends
| American Bath Group | LIXIL |
| ASSA ABLOY | Mansfield Plumbing Products |
| Fluidmaster | Masco |
| Fortune Brands Innovations | Sloan Valve |
| Global Union | Watts Water Technologies |
| Jacuzzi Brands | Zurn Elkay Water Solutions |
| Kohler |
US Plumbing Fixtures & Fittings Report Scope
This study analyzes US demand for plumbing fixtures and fittings by product type, material (for fixtures), market, and region and subregion.
Plumbing fixtures covered in this study include:
-
bathtub and shower fixtures
-
bathtubs
-
whirlpool bathtubs
-
shower stalls and receptors
-
bathtub and shower surrounds, including shower pans and basins
-
-
sink fixtures
-
lavatories (bathroom sinks)
-
kitchen sinks
-
other sinks, including those installed in bars, laundry rooms, utility rooms, washrooms, and outdoor living areas
-
-
toilet fixtures
-
toilet bowls
-
flush tanks
-
urinals
-
bidets
-
-
hot tubs and spas
-
bottle filling stations
-
other plumbing fixtures, including drinking fountains, eyewash fountains, multiuser wash stations, emergency showers, patient care modules, and portable chemical toilets
Plumbing fittings covered by the study include:
-
lavatory fittings
-
two-lever controls, including 4-inch centerset and widespread types
-
single-lever controls
-
other lavatory fittings, including wall-mount faucets, commercial-grade touchless faucets, and other fittings
-
-
bathtub and shower fittings:
-
antiscald valves (pressure-balanced and thermostatic single-lever control valves)
-
single-lever controls
-
showerheads and related fittings (massagers, rainfall showerheads, multiple-head showers, LED showerheads, aromatherapy products)
-
bathtub and showerhead combinations (handheld showerheads that are a part of the bathtub and showerhead combination, tub spouts, two-valve controls, three-valve controls)
-
personal showers (also called handheld showers)
-
other bathtubs and fittings (bathtub fillers, wall-mount faucets or taps, spray units installed independently of the main bathtub or shower fitting)
-
-
kitchen and other sink fittings:
-
single-lever controls
-
deck faucets (kitchen faucets, bar faucets, faucets for laundry and other utility sinks)
-
miscellaneous sink fittings (wall-mount faucets, single-sink faucets, sink strainers, pot fillers, spray attachments. other sink fittings)
-
-
other plumbing fittings:
-
lawn and hose fittings (spray guns, sprinkler fittings, flow-switching attachments)
-
flush valves and controls (toilet levers, flappers, float balls, sealant rings, tank balls, seals, seat discs, flapper chains, repair valves)
-
drains and overflows
-
sediment, sill, and other faucets
-
P- and S-traps
-
all other plumbing fittings (escutcheons; mechanical connecting fittings for iron pipes; compression fittings; fire sprinkler heads and related components; hangers, brackets, and supports; spa pumps; plugs and caps; strainers; bidet fittings; drain outlets; drain gates; and fittings not mentioned elsewhere)
-
Fixture materials discussed in this study include:
-
porcelain, also known as vitreous china or vitrified porcelain
-
plastics (acrylic and other resins such as ABS, polystyrene, and PVC)
-
fiberglass
-
cast polymers (solid surface and cultured stone)
-
metal (stainless and porcelain enameled steel; cast iron; and other metals, including brass, copper, aluminum, and titanium)
-
other materials (concrete, wood, natural and engineered stone, glass, glazed earthenware, and nonmetal composites)
Market segments are:
-
new residential
-
residential improvement and repair
-
new commercial
-
commercial improvement and repair
The residential market is further segmented by housing type (single-family, multifamily, and manufactured housing), while the commercial market is segmented by building type (office, retail, and lodging; institutional; and industrial and other commercial buildings).
Products or markets excluded from the scope of this study includes:
-
behind-the-wall plumbing
-
saunas
-
plumbing fixtures or fittings installed in a vehicle (e.g., airplane, RV, etc.)
Historical data for 2014, 2019, and 2024, and forecasts for 2029 and 2034 are presented for both plumbing fixtures and fittings in current dollars (which are not adjusted for inflation) and for fixtures in volume terms (units). Annual demand from 2021 to 2028 is presented in the Overview.
- Executive Summary
- Figure 1-1. US Plumbing Fixtures & Fittings Market Trends
- Short-Term Analysis
- Economic Forecast
- Table | Macroeconomic Indicators, 2023, 2024, 2025, &2026 (billion 2017 dollars & billion dollars)
- Short-Term Construction Outlook
- Table | Construction Expenditures, 2023, 2024, 2025, &2026 (billion 2017 dollars & billion dollars)
- Short-Term Plumbing Industry Trends
- Table | Annual Plumbing Fixture & Fitting Demand by Product, 2022 – 2026 (million dollars)
- Table | Annual Plumbing Fixture & Fitting Demand by Market, 2022 – 2026 (million dollars)
- Figure 2-1. Plumbing Fixture & Fitting Value Demand Growth by Market, 2021 – 2026 (annual % change)
- Economic Forecast
- Overview
- Study Scope
- Figure 3-1. Plumbing Fixtures & Fittings: Examples
- Historical Market Trends & Growth Factors
- Table | Plumbing Fixture & Fitting Demand, 2014 – 2024 (million dollars & % change)
- Figure 3-2. Plumbing Fixture & Fitting Demand, 2004 – 2024 (million dollars)
- Supply & Demand
- Demand Outlook
- Table | Plumbing Fixture & Fitting Supply & Demand by Category, 2014, 2019, 2024, 2029, &2034 (million dolla
- Table | Annual Plumbing Fixture & Fitting Supply & Demand by Category, 2021 – 2028 (million dollars)
- Figure 3-3. Plumbing Fixture & Fitting Demand by Product, 2014, 2019, 2024, 2029, &2034 (million dol
- Imports
- Figure 3-4. US Plumbing Fixture & Fitting Imports Share by Source, 2024 (billion dollars)
- Exports
- Figure 3-5. US Plumbing Fixture & Fitting Exports Share by Destination, 2024 (million dollars)
- Production
- Table | Plumbing Fixture & Fitting Production by Product, 2014, 2019, 2024, 2029, &2034 (million dollars)
- Table | Annual Plumbing Fixture & Fitting Production by Product, 2021 – 2028 (million dollars)
- Demand Outlook
- Markets Overview
- Table | Plumbing Fixture & Fitting Demand by Market, 2014, 2019, 2024, 2029, &2034 (million dollars)
- Table | Annual Plumbing Fixture & Fitting Demand by Market, 2021 – 2028 (million dollars)
- Figure 3-6. Plumbing Fixture & Fitting Demand by Market, 2014, 2019, 2024, 2029, &2034 (million doll
- Pricing Trends
- Table | Plumbing Fixture & Fitting Prices, 2014, 2019, 2024, 2029, &2034 (2023=100)
- Table | Annual Plumbing Fixture & Fitting Prices 2021 – 2028 (2023=100)
- Figure 3-7. Plumbing Fixture & Fitting Prices, 2014 – 2029 (dollars per unit)
- Study Scope
- Factors Impacting Plumbing Product Demand
- Building Construction Outlook
- Table | Building Construction Expenditures, 2014, 2019, 2024, 2029, &2034 (billion 2017 dollars and billion
- Housing Stock & Average Age of Existing Homes
- Table | Housing Stock by Type, 2014, 2019, 2024, 2029, &2034 (million units)
- Figure 4-1. Housing Stock: Share by Decade of Construction, 2024 (%)
- Home Kitchen & Bathroom Remodeling Activity
- Table | Home Kitchen & Bathroom Remodeling Spending, 2014, 2019, 2024, 2029, &2034 (million dollars)
- Home Design Trends
- Building Codes & Regulations
- Sustainability Initiatives
- Water Conservation Efforts
- WaterSense
- LEED
- CALGreen & Other State Efforts
- Table | Selected State-Level Water Efficiency Programs
- Skilled Labor Shortage
- Installation Costs
- Building Construction Outlook
- Plumbing Fixture Products
- Scope & Product Description
- Figure 5-1. Plumbing Fixtures: Product Examples
- Demand by Fixture Type
- Table | Plumbing Fixture Demand by Type, 2014, 2019, 2024, 2029, &2034 (million dollars & thousand units)
- Bathtub & Shower Fixtures
- Demand by Type
- Table | Bathtub & Shower Fixture Demand by Type, 2014, 2019, 2024, 2029, &2034 (million dollars & thousand u
- Figure 5-2. Bathtub & Shower Fixtures: Product Examples
- Bathtubs
- Table | Bathtub Demand by Material, 2014, 2019, 2024, 2029, &2034 (million dollars & thousand units)
- Figure 5-3. Bathtub Demand, 2014 – 2029 (million dollars)
- Whirlpool Bathtubs
- Table | Whirlpool Bathtub Demand by Material, 2014, 2019, 2024, 2029, &2034 (million dollars & thousand unit
- Figure 5-4. Whirlpool Bathtub Demand, 2014 – 2029 (million dollars)
- Shower Stalls & Receptors
- Table | Shower Stall & Receptor Demand by Material, 2014, 2019, 2024, 2029, &2034 (million dollars & thousan
- Figure 5-5. Shower Stall & Receptor Demand, 2014 – 2029 (million dollars)
- Bathtub & Shower Surrounds
- Table | Bathtub & Shower Surround Demand by Material, 2014, 2019, 2024, 2029, &2034 (million dollars & thous
- Figure 5-6. Bathtub & Shower Surround Demand, 2014 – 2029 (million dollars)
- Demand by Type
- Sink Fixtures
- Demand by Type
- Table | Sink Fixture Demand by Type, 2014, 2019, 2024, 2029, &2034 (million dollars & thousand units)
- Figure 5-7. Sink Fixtures: Product Examples
- Lavatories (Bathroom Sinks)
- Table | Lavatory (Bathroom Sink) Demand by Material, 2014, 2019, 2024, 2029, &2034 (million dollars & thousa
- Figure 5-8. Lavatory Demand, 2014 – 2029 (million dollars)
- Kitchen Sinks
- Table | Kitchen Sink Demand by Material, 2014, 2019, 2024, 2029, &2034 (million dollars & thousand units)
- Figure 5-9. Kitchen Sink Demand, 2014 – 2029 (million dollars)
- Other Sinks
- Table | Other Sink Demand by Material, 2014, 2019, 2024, 2029, &2034 (million dollars & thousand units)
- Figure 5-10. Other Sink Demand, 2014 – 2029 (million dollars)
- Demand by Type
- Toilet Fixtures
- Demand by Type
- Table | Toilet Fixture Demand by Type, 2014, 2019, 2024, 2029, &2034 (million dollars & thousand units)
- Figure 5-11. Toilet Fixtures: Product Examples
- Toilet Bowls
- Table | Toilet Bowl Demand by Material, 2014, 2019, 2024, 2029, &2034 (million dollars & thousand units)
- Figure 5-12. Toilet Bowl Demand, 2014 – 2029 (million dollars)
- Flush Tanks
- Table | Flush Tank Demand by Material, 2014, 2019, 2024, 2029, &2034 (million dollars & thousand units)
- Figure 5-13. Flush Tank Demand, 2014 – 2029 (million dollars)
- Urinals
- Table | Urinal Demand by Material, 2014, 2019, 2024, 2029, &2034 (million dollars & thousand units)
- Figure 5-14. Urinal Demand, 2014 – 2029 (million dollars)
- Bidets
- Table | Bidet Demand by Material, 2014, 2019, 2024, 2029, &2034 (million dollars & thousand units)
- Figure 5-15. Bidet Demand, 2014 – 2029 (million dollars)
- Demand by Type
- Hot Tubs & Spas
- Table | Hot Tub & Spa Demand by Material, 2014, 2019, 2024, 2029, &2034 (million dollars & thousand units)
- Figure 5-16. Hot Tub & Spa Demand, 2014 – 2029 (million dollars)
- Figure 5-17. Hot Tubs & Spas: Product Examples
- Bottle Filling Stations
- Table | Bottle Filling Station Demand, 2014, 2019, 2024, 2029, &2034 (million dollars & thousand units)
- Figure 5-18. Bottle Filling Station Demand, 2014 – 2029 (million dollars)
- Figure 5-19. Bottle Filling Stations: Product Examples
- Other Plumbing Fixtures
- Table | All Other Plumbing Fixture Demand by Product & Material, 2014, 2019, 2024, 2029, &2034 (million doll
- Figure 5-20. All Other Plumbing Fixture Demand, 2014 – 2029 (million dollars)
- Figure 5-21. Other Plumbing Fixtures: Product Examples
- Market Share
- Figure 5-22. Plumbing Fixture Market Share by Company, 2024 (billion dollars)
- Scope & Product Description
- Plumbing Fixture Materials
- Plumbing Fixture Demand by Material
- Table | Plumbing Fixture Demand by Material, 2014, 2019, 2024, 2029, &2034 (million dollars & thousand units
- Figure 6-1. Plumbing Fixture Demand by Material, 2014, 2019, 2024, 2029, &2034 (million dollars)
- Plastics
- Demand by Material Type
- Table | Plastic Plumbing Fixture Demand by Material, 2014, 2019, 2024, 2029, &2034 (million dollars & thousa
- Acrylic
- Table | Acrylic Plumbing Fixture Demand by Product, 2014, 2019, 2024, 2029, &2034 (million dollars & thousan
- Other Plastics
- Table | Other Plastic Plumbing Fixture Demand by Product, 2014, 2019, 2024, 2029, &2034 (million dollars & t
- Demand by Material Type
- Metal
- Demand by Metal Type
- Table | Metal Plumbing Fixture Demand by Metal Type, 2014, 2019, 2024, 2029, &2034 (million dollars & thousa
- Steel
- Table | Steel Plumbing Fixture Demand by Product, 2014, 2019, 2024, 2029, &2034 (million dollars & thousand
- Cast Iron
- Table | Cast Iron Plumbing Fixture Demand by Product, 2014, 2019, 2024, 2029, &2034 (million dollars & thous
- Other Metals
- Table | Other Metal Plumbing Fixture Demand by Product, 2014, 2019, 2024, 2029, &2034 (million dollars & tho
- Demand by Metal Type
- Porcelain (Vitreous China)
- Table | Porcelain Plumbing Fixture Demand by Product, 2014, 2019, 2024, 2029, &2034 (million dollars & thous
- Fiberglass
- Table | Fiberglass Plumbing Fixture Demand by Product, 2014, 2019, 2024, 2029, &2034 (million dollars & thou
- Cast Polymers
- Table | Cast Polymer Plumbing Fixture Demand by Product, 2014, 2019, 2024, 2029, &2034 (million dollars & th
- Other Materials
- Table | Other Materials Plumbing Fixture Demand by Product, 2014, 2019, 2024, 2029, &2034 (million dollars &
- Plumbing Fixture Demand by Material
- Plumbing Fittings
- Scope & Product Description
- Figure 7-1. Plumbing Fittings: Product Examples
- Plumbing Fitting Products Demand by Type
- Table | Plumbing Fitting Demand by Product, 2014, 2019, 2024, 2029, &2034 (million dollars)
- Lavatory (Bathroom Sink) Fittings
- Demand by Product
- Table | Lavatory Fitting Demand by Product, 2014, 2019, 2024, 2029, &2034 (million dollars)
- Figure 7-2. Lavatory (Bathroom Sink) Fittings: Product Examples
- Two-Lever Controls
- Figure 7-3. Two-Lever Control Demand, 2014 – 2029 (million dollars)
- Single-Lever Controls
- Figure 7-4. Single-Lever Lavatory Control Demand, 2014 – 2029 (million dollars)
- Other Lavatory Fittings
- Figure 7-5. Other Lavatory Fitting Demand, 2014 – 2029 (million dollars)
- Demand by Product
- Bathtub & Shower Fittings
- Demand by Product
- Table | Bathtub & Shower Fitting Demand by Product, 2014, 2019, 2024, 2029, &2034 (million dollars)
- Figure 7-6. Bathtub & Shower Fittings: Product Examples
- Antiscald Valves
- Figure 7-7. Antiscald Valve Demand, 2014 – 2029 (million dollars)
- Single-Lever Controls
- Figure 7-8. Single-Lever Bathtub & Shower Control Demand, 2014 – 2029 (million dollars)
- Showerheads & Specialty Fittings
- Figure 7-9. Showerhead & Specialty Fitting Demand, 2014 – 2029 (million dollars)
- Bathtub & Shower Combinations
- Figure 7-10. Bathtub & Shower Combination Demand, 2014 – 2029 (million dollars)
- Personal Showers
- Figure 7-11. Personal Shower Demand, 2014 – 2029 (million dollars)
- Other Bathtub & Shower Fittings
- Figure 7-12. Other Bathtub & Shower Fitting Demand, 2014 – 2029 (million dollars)
- Demand by Product
- Kitchen & Other Sink Fittings
- Demand by Product
- Table | Kitchen & Other Sink Fitting Demand by Product, 2014, 2019, 2024, 2029, &2034 (million dollars)
- Figure 7-13. Kitchen & Other Sink Fittings: Product Examples
- Single-Lever Controls
- Figure 7-14. Kitchen & Other Sink Fittings: Single-Lever Control Demand, 2014 – 2029 (million dollar
- Deck Faucets
- Figure 7-15. Deck Faucet Demand, 2014 – 2029 (million dollars)
- Other Sink Fittings
- Figure 7-16. Other Sink Fitting Demand, 2014 – 2029 (million dollars)
- Demand by Product
- Other Plumbing Fittings
- Demand by Product
- Table | Other Plumbing Fitting Demand by Product, 2014, 2019, 2024, 2029, &2034 (million dollars)
- Figure 7-17. Other Plumbing Fittings: Product Examples
- Flush Valves & Controls
- Figure 7-18. Flush Valves & Controls Demand, 2014 – 2029 (million dollars)
- Lawn & Hose Fittings
- Figure 7-19. Lawn & Hose Fitting Demand, 2014 – 2029 (million dollars)
- Drains & Overflows
- Figure 7-20. Drains & Overflow Demand, 2014 – 2029 (million dollars)
- Sediment, Sill, &Other Faucets
- Figure 7-21. Sediment, Sill, &Other Faucet Demand, 2014 – 2029 (million dollars)
- P- & S-Traps
- Figure 7-22. P- & S-Trap Demand, 2014 – 2029 (million dollars)
- All Other Plumbing Fittings
- Figure 7-23. All Other Plumbing Fitting Demand, 2014 – 2029 (million dollars)
- Figure 7-24. All Other Plumbing Fittings: Product Examples
- Demand by Product
- Market Share
- Figure 7-25. Plumbing Fittings Market Share by Company, 2024 (billion dollars)
- Scope & Product Description
- Residential Markets
- Market Scope
- Residential Plumbing Fixture & Fitting Demand by Product
- Table | Residential Plumbing Fixture & Fitting Demand by Product, 2014, 2019, 2024, 2029, &2034 (million dol
- Demand by Application
- New vs. Improvement & Repair
- Table | Residential Plumbing Fixture & Fitting Demand: New vs Improvement & Repair, 2014, 2019, 2024, 2029,
- New Residential Plumbing
- Table | New Residential Plumbing Fixture & Fitting Demand by Product, 2014, 2019, 2024, 2029, &2034 (million
- Residential Improvement & Repair
- Table | Residential Improvement & Repair Plumbing Fixture & Fitting Demand by Product, 2014, 2019, 2024, 202
- New vs. Improvement & Repair
- Housing Types
- Demand by Housing Type
- Table | Residential Plumbing Fixture & Fitting Demand by Housing Type, 2014, 2019, 2024, 2029, &2034 (millio
- Single-Family
- Table | Single-Family Housing Plumbing Fixture & Fitting Demand by Product & Application, 2014, 2019, 2024,
- Multifamily
- Table | Multifamily Housing Plumbing Fixture & Fitting Demand by Product & Application, 2014, 2019, 2024, 20
- Manufactured Housing
- Table | Manufactured Housing Plumbing Fixture & Fitting Demand by Product & Application, 2014, 2019, 2024, 2
- Demand by Housing Type
- Commercial Markets
- Market Scope
- Commercial Plumbing Fixture & Fitting Demand by Product
- Table | Commercial Plumbing Fixture & Fitting Demand by Product, 2014, 2019, 2024, 2029, &2034 (million doll
- Demand by Application
- New vs. Improvement & Repair
- Table | Commercial Plumbing Fixture & Fitting Demand: New vs. Improvement & Repair, 2014, 2019, 2024, 2029,
- New Commercial Plumbing
- Table | New Commercial Plumbing Fixture & Fitting Demand by Product, 2014, 2019, 2024, 2029, &2034 (million
- Improvement & Repair
- Table | Commercial Improvement & Repair Plumbing Fixture & Fitting Demand by Product, 2014, 2019, 2024, 2029
- New vs. Improvement & Repair
- Building Types
- Demand by Building Type
- Table | Commercial Plumbing Fixture & Fitting Demand by Building Type, 2014, 2019, 2024, 2029, &2034 (millio
- Office, Retail, &Lodging
- Table | Office, Retail, &Lodging Plumbing Fixture & Fitting Demand by Product & Application, 2014, 2019, 202
- Institutional
- Table | Institutional Plumbing Fixture & Fitting Demand by Product & Application, 2014, 2019, 2024, 2029, &2
- Industrial
- Table | Industrial Plumbing Fixture & Fitting Demand by Product & Application, 2014, 2019, 2024, 2029, &2034
- Other Commercial Buildings
- Table | Other Commercial Plumbing Fixture & Fitting Demand by Product & Application, 2014, 2019, 2024, 2029,
- Demand by Building Type
- Regional Trends
- Plumbing Fixture & Fitting Demand by Region & Subregion
- Table | Plumbing Fixture & Fitting Demand by Region & Subregion, 2014, 2019, 2024, 2029, &2034 (million doll
- Northeast
- New England Plumbing Fixture & Fitting Demand by Market & Product
- Table | New England Plumbing Fixture & Fitting Demand by Market & Product, 2014, 2019, 2024, 2029, &2034 (mi
- Middle Atlantic Plumbing Fixture & Fitting Demand by Market & Product
- Table | Middle Atlantic Plumbing Fixture & Fitting Demand by Market & Product, 2014, 2019, 2024, 2029, &2034
- New England Plumbing Fixture & Fitting Demand by Market & Product
- Midwest
- East North Central Plumbing Fixture & Fitting Demand by Market & Product
- Table | East North Central Plumbing Fixture & Fitting Demand by Market & Product, 2014, 2019, 2024, 2029, &2
- West North Central Plumbing Fixture & Fitting Demand by Market & Product
- Table | West North Central Plumbing Fixture & Fitting Demand by Market & Product, 2014, 2019, 2024, 2029, &2
- East North Central Plumbing Fixture & Fitting Demand by Market & Product
- South
- South Atlantic Plumbing Fixture & Fitting Demand by Market & Product
- Table | South Atlantic Plumbing Fixture & Fitting Demand by Market & Product, 2014, 2019, 2024, 2029, &2034
- East South Central Plumbing Fixture & Fitting Demand by Application & Product
- Table | East South Central Plumbing Fixture & Fitting Demand by Market & Product, 2014, 2019, 2024, 2029, &2
- West South-Central Plumbing Fixture & Fitting Demand by Market & Product
- Table | West South Central Plumbing Fixture & Fitting Demand by Market & Product, 2014, 2019, 2024, 2029, &2
- South Atlantic Plumbing Fixture & Fitting Demand by Market & Product
- West
- Mountain Plumbing Fixture & Fitting Demand by Market & Product
- Table | Mountain Plumbing Fixture & Fitting Demand by Market & Product, 2014, 2019, 2024, 2029, &2034 (milli
- Pacific Plumbing Fixture & Fitting Demand by Market & Product
- Table | Pacific Plumbing Fixture & Fitting Demand by Market & Product, 2014, 2019, 2024, 2029, &2034 (millio
- Mountain Plumbing Fixture & Fitting Demand by Market & Product
- Plumbing Fixture & Fitting Demand by Region & Subregion
- Industry Structure
- Key Findings & Industry Composition
- Table | US Plumbing Fixture & Fitting Sales by Company, 2024 (million dollars)
- Market Share
- Figure 11-1. US Plumbing Fixture & Fitting Market Share by Company, 2024 (billion dollars)
- Figure 11-2. US Plumbing Fixture & Fitting Market: Leading Supplier, 2024
- Figure 11-3. US Plumbing Fixture & Fitting Market: Second Leading Supplier, 2024
- Figure 11-4. US Plumbing Fixture & Fitting Market: Third Leading Supplier, 2024
- Competitive Strategies
- Horizontal & Vertical Integration
- Outsourcing
- Marketing
- Focus on High-Growth Markets
- Mergers & Acquisitions
- Table | Selected Mergers & Acquisitions
- Distribution Channels
- List of Industry Participants
- Table | Selected Industry Participants: Plumbing Fixtures
- Table | Selected Industry Participants: Plumbing Fittings
- Key Findings & Industry Composition
- Appendix
- Report Details
- Table | Study Scope: US Geographic Regions & Subregions
- Table | Relevant Industry Codes
- Table | Relevant HS Codes
- Definitions
- Abbreviations
- Table | Abbreviations & Acronyms Used in Study
- Freedonia Methodology
- Study-Specific Methodology
- Sources
- Associations & Agencies
- Related Studies & Reports
- Macroeconomic Assumptions
- Economic Environment
- Table | Macroeconomic Indicators, 2014, 2019, 2024, 2029, &2034 (billion 2017 dollars)
- Demographics
- Table | Population & Households, 2014, 2019, 2024, 2029, &2034 (million persons)
- Building Construction
- Table | Building Construction Expenditures, 2014, 2019, 2024, 2029, &2034 (billion 2017 dollars & billion do
- Residential Building Construction
- Table | Residential Building Construction Expenditures, 2014, 2019, 2024, 2029, &2034 (billion 2017 dollars
- Residential Improvements & Repairs
- Table | Residential Improvement & Repair Expenditures, 2014, 2019, 2024, 2029, &2034 (billion 2017 dollars &
- Commercial Building Construction
- Table | Commercial Building Construction Expenditures, 2014, 2019, 2024, 2029, &2034 (billion 2017 dollars &
- Commercial Building Improvements & Repairs
- Table | Commercial Building Improvement & Repair Expenditures, 2014, 2019, 2024, 2029, &2034 (billion 2017 d
- Housing Completions
- Table | New Housing Indicators, 2014, 2019, 2024, 2029, &2034 (thousand units)
- Housing Stock
- Table | Housing Stock by Type, 2014, 2019, 2024, 2029, &2034 (million units)
- Figure 12-1. Housing Stock: Share by Year of Construction, 2024 (%)
- Consumer Financing
- Table | Consumer Financing Environment, 2014 – 2024
- Economic Environment
- Report Details
Demand for plumbing fixtures and fittings in the US reached over $18 billion in 2024.
Imports account for a noticeable share – 15% of the market in 2024 – of US plumbing fixture and fitting demand.
Leading plumbing product companies include Fortune Brands, Kohler, and Masco.
Related Reports

US Pipe Products & Markets
US Pipe Market Share