

US Air & Water Barriers
This report analyzes the $7 billion US air and water barrier industry, presenting historical sales data (2014, 2019, and 2024) and forecasts (2029 and 2034) by market, product, material and installation method.
Free Sample Report
Request a free sample of this report and our team will email it to you.
Report Overview
From Code Compliance to Innovation: What’s Driving Change in the US Air and Water Barrier Market?
Key themes covered in US Air & Water Barriers
- The contribution of air and water barriers to energy-efficient building envelopes, including their role in minimizing air leakage and moisture intrusion, and their impact on overall HVAC efficiency.
- Analyzing the increasing demand for eco-friendly air and water barriers made from sustainable materials, low-VOC adhesives, and energy-efficient properties, and how this aligns with green building certifications like LEED.
- An in-depth look at the cost breakdown for various air and water barrier systems, including materials, installation, and labor, as well as how these costs have been impacted by supply chain disruptions and raw material shortages.
- Exploration of the growing demand for air and water barriers in building renovation and retrofitting, particularly in older buildings where moisture control and energy efficiency are top priorities.
Featuring 75 Tables and 16 Figures!
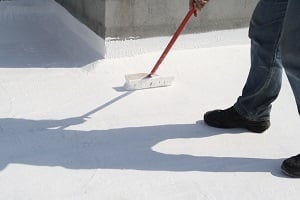
Demand for air and water barriers in the US totaled $7.0 billion in 2024 and is forecast to increase 3.7% per year to $8.4 billion in 2029. Growth will be driven by an increase in building construction activity, most notably rising single-family housing starts, along with a greater focus on energy efficiency and moisture control in a variety of structures.
Air & Water Barriers Are Key to Energy-Efficient Buildings
Demand for air and water barriers in the US will rise due to a combination of stricter building codes, a focus on energy efficiency and sustainability, and rising awareness of moisture control. As energy efficiency and sustainability standards, such as those outlined in IECC and LEED certifications, become more stringent, the need for high-performance air and water barriers that improve airtightness and reduce energy consumption rises. This is further driven by a growing focus on reducing heating and cooling costs, with builders seeking solutions that enhance thermal performance.
Retrofitting and renovation projects are creating new opportunities for these systems as older buildings are upgraded to meet modern energy efficiency and moisture control requirements, especially in commercial real estate.
From Flexibility to Durability, Advances in Barrier Materials Are Changing the Industry
Advances in material technologies for air and water barriers are enhancing their effectiveness, durability, and ease of installation:
- Self-adhered membranes and liquid-applied coatings now offer improved flexibility and strength, creating seamless, waterproof seals that reduce labor costs and installation time.
- High-performance synthetic materials like polyethylene, polypropylene, and synthetic rubber are increasingly used due to their superior durability, UV resistance, and moisture protection.
These innovations have resulted in thinner, lighter products that are easier to handle, more resistant to damage, and more cost-effective for builders, improving overall performance and meeting stricter energy and sustainability standards.
Resilient Structures: How Air & Water Barriers Are Protecting Against Climate Change
As infrastructure and large building projects continue apace, the focus on resilience to environmental factors like climate change and extreme weather is growing. Air and water barriers are essential in enhancing the durability of these projects by protecting structures from moisture infiltration, which can lead to deterioration. These barriers help safeguard buildings and other structures from the impacts of heavy rain, flooding, and temperature fluctuations, all of which are becoming more common due to climate change.
High-performance barriers such as bituminous membranes and rubber coatings are increasingly used in infrastructure to prevent water damage and corrosion. They also improve energy efficiency by preventing air leaks and moisture buildup, contributing to the long-term sustainability and resilience of buildings and infrastructure in urban environments.
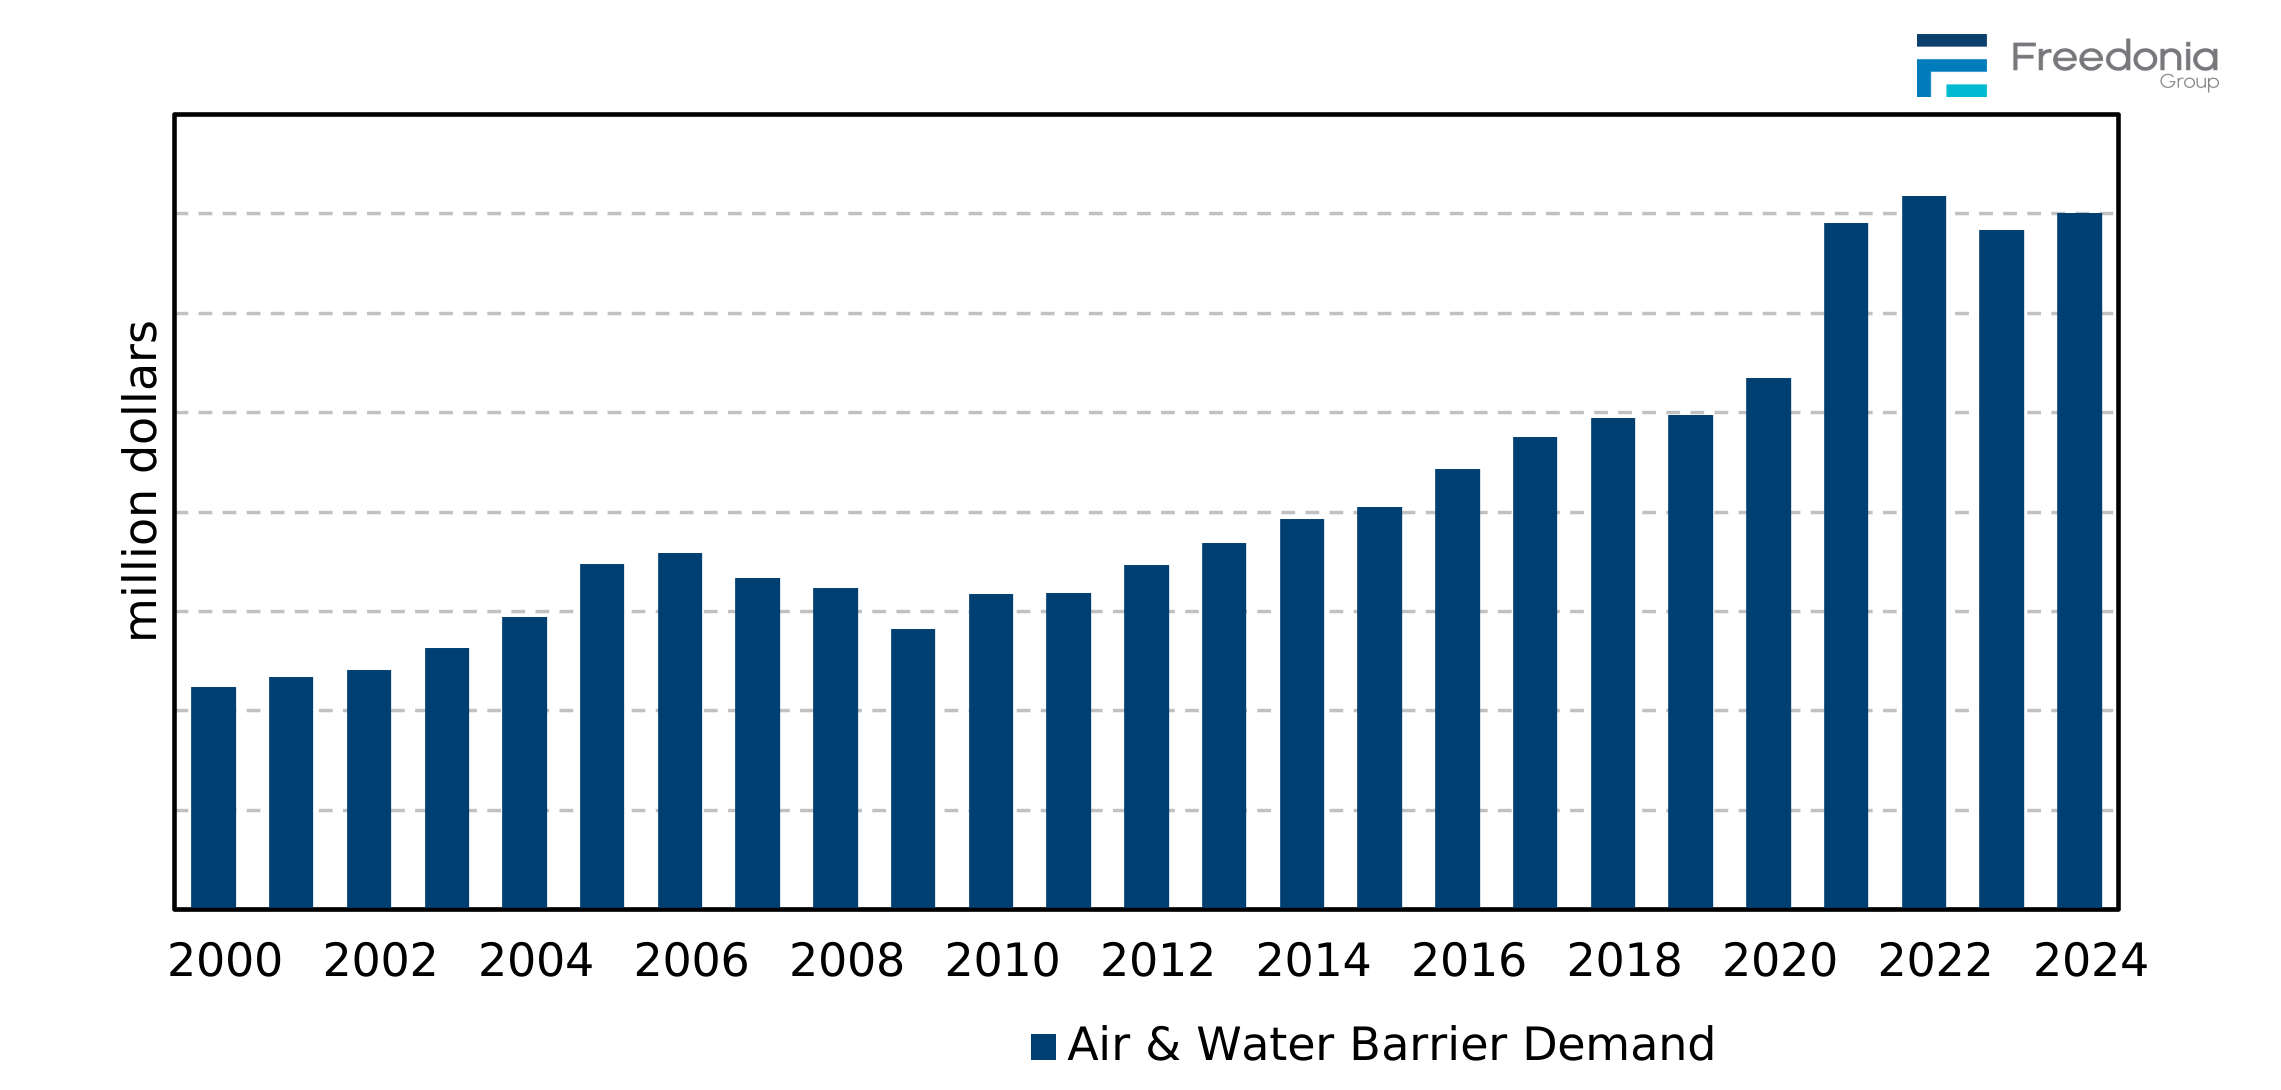
Historical Market Trends & Growth Drivers
Shifts in demand for air and water barrier products can vary from year to year and are determined by numerous factors, primarily those related to building construction activity. They include:
-
levels of housing starts, particularly in the single-family housing segment
-
the size and age of the US housing stock
-
interest rates – low interest rates may encourage home and business owners to take out lines of credit often used to fund repair and replacement projects
-
the number and type of commercial buildings erected or repaired in any given year
-
the types of air and water barrier materials most often specified by contractors and other consumers in a particular region of the US
-
the air and water barrier materials originally installed on the surface
Additionally, multiple other variables can affect demand for air and water barriers in a particular year or over a short period of time. Among these are:
-
weather conditions, especially outbreaks of severe weather that can cause widespread damage to roofs (e.g., hurricanes and tropical storms, tornadoes, hailstorms, and winter storms)
-
modifications to state and local building codes
-
changes in the price of raw materials (e.g., asphalt, metal, acrylics, plastics) that can cause the per-square foot or linear foot cost of air and water barrier materials to increase or decrease sharply
Demand by Market
Markets Overview
Air and water barriers are used on buildings and various other structures (e.g., bridges), with demand at the broadest level divided between three large markets:
-
residential buildings
-
commercial buildings
-
infrastructure
The residential market accounts for a greater share of air and water barrier demand in any given year because of the large numbers of new homes – especially single-family homes – that are erected annually. The residential market will continue accounting for the larger share of air and water barrier demand.
Demand for air and water barriers is projected to grow 3.7% annually, reaching a market value of $8.4 billion in 2029:
-
Homeowners and builders will continue to focus on energy performance through airtightness and moisture control, driving demand for air and water barriers like self-adhered membranes and liquid-applied coatings, especially in climates with high humidity or temperature fluctuations.
-
The demand for high-performance building envelopes in commercial buildings to meet energy efficiency and water protection standards will support the use of advanced air and water barriers.
- The need for durable, high-performance barriers to protect against water damage and corrosion in challenging environments (e.g., tunnels, bridges) will increase in the infrastructure segment, with solutions like bituminous membranes and rubber coatings maintaining popularity in infrastructure projects.
US Air & Water Barriers Report Coverage:
| Current Total Market Size | $7 billion |
| Forecast Total Market Growth Rate | 3.7% CAGR from 2024-2029 |
| Historical Period | 2014, 2019, 2022-2024 |
| Forecast Period | 2025, 2026, 2029, 2034 |
| Units Covered | Revenue in million USD, million square feet, million linear feet |
| Regions | US |
| Countries Individually Covered | n/a |
| Products | Waterproofing, Water-Resistive & Air Barriers, Flashing |
| Markets | Residential, Commercial, Infrastructure |
| Installation Methods | Mechanically Attached, Self-Adhered, Liquid-Applied |
| Materials | Plastic, Asphaltic, Rubber, Metal, Cementitious, Bentonite |
| Point Where Data is Measured | Manufacturer’s Level, Ex Factory |
| Additional Elements | Market Share, Short Term Industry Trends, Pricing & Inflation, Building Codes & Regulations, Sustainability Initiatives, New Product Development |
Key Industry Participants Driving Trends
| Carlisle Companies | Huber Engineered Woods |
| CertainTeed | Magnera |
| DuPont | Owens Corning |
| GAF Materials | RPM International |
| GCP Applied Technologies | Sika |
US Air & Water Barriers Report Scope
This study analyzes US air and water barrier demand by product and market. Historical data for 2014, 2019, and 2024 and forecasts to 2029 and 2034 are provided for air and water barrier product demand in value terms in US dollars. For selected products, demand is also presented in square feet. Flashing demand is presented in linear feet. Annual data for 2021 to 2028 is provided for total product, market, installation method, and material demand.
Air and water barrier demand is segmented into the following product types:
-
waterproofing products
-
waterproofing membranes, including modified bituminous membranes, synthetic membranes, and bentonite sheets
-
waterproofing coatings (e.g., asphaltic, cementitious, rubber)
-
-
water-resistive and air barriers:
-
asphalt felt (also known as tar paper)
-
building (house) wrap
-
synthetic underlayment
-
asphaltic damp proofing
-
building paper
-
-
flashing
-
metal and rigid plastic
-
flashing tape (e.g., acrylic, butyl rubber, asphaltic)
-
liquid flashing
-
The various products are further segmented by material:
-
metal
-
asphalt
-
plastic
-
rubber
-
cementitious
-
bentonite
Excluded from the scope of this report are the following products:
-
liquid-applied roof coatings
-
sealants and caulks
-
deck flashing and any type of flashing paints or coatings that may be applied to flashing to protect it and allow it to better blend in with a building’s existing décor
-
nonbuilding structures, such as decking, fencing, swimming pools, and all interior applications, such as bathrooms and other wet rooms
-
other products such as rigid foam insulation board, rainscreens, and specific types of combination WRB/sheathing panels that can serve as WRBs or air barriers if sealed correctly (e.g., Huber Engineered Woods’ ZIP System)
Demand is also segmented into markets:
-
residential (new and improvement and repair)
-
commercial (new and improvement and repair)
-
infrastructure
Demand is also segmented into the following applications:
-
above-grade
-
below-grade
Furthermore, demand can be analyzed by installation method:
-
self-adhered
-
liquid-applied
-
mechanically attached
The study also presents product prices (at the manufacturers’ level) for selected major product types for the relevant unit of measurement (e.g., dollars per linear foot for flashing).
- Executive Summary
- Figure 1-1. US Air & Water Barriers Market
- Short-Term Analysis
- Economic Forecast
- Table | Macroeconomic Indicators, 2023, 2024, 2025, &2026 (billion 2017 dollars & billion dollars)
- Short-Term Construction Outlook
- Table | Construction Expenditures, 2023, 2024, 2025, &2026 (billion 2017 dollars & billion dollars)
- Short-Term Air & Water Barriers Industry Trends
- Table | Annual Air & Water Barrier Demand by Market & Product, 2022 - 2026 (million dollars)
- Figure 2-1. Annual Air & Water Barrier Demand, 2022 - 2026 (million dollars)
- Economic Forecast
- Overview
- Study Scope
- Figure 3-1. Air & Water Barriers: Product Examples
- Historical Market Trends & Growth Drivers
- Table | Air & Water Barrier Demand, 2014 - 2024 (million dollars)
- Figure 3-2. Air & Water Barrier Demand, 2000 - 2024 (million dollars)
- Products Overview
- Table | Air & Water Barrier Demand by Product, 2014, 2019, 2024, 2029, &2034 (million dollars)
- Table | Annual Air & Water Barrier Demand by Product, 2021 - 2028 (million dollars)
- Demand by Market
- Markets Overview
- Table | Air & Water Barrier Demand by Market, 2014, 2019, 2024, 2029, &2034 (million dollars)
- Table | Annual Air & Water Barrier Demand by Market, 2021 - 2028 (million dollars)
- Residential Buildings
- Table | Residential Air & Water Barrier Demand by Product, 2014, 2019, 2024, 2029, &2034 (million dollars)
- Table | Annual Residential Air & Water Barrier Demand by Product, 2021 - 2028 (million dollars)
- Commercial Buildings
- Table | Commercial Air & Water Barrier Demand by Product, 2014, 2019, 2024, 2029, &2034 (million dollars)
- Table | Annual Commercial Air & Water Barrier Demand by Product, 2021 - 2028 (million dollars)
- Infrastructure
- Table | Infrastructure Air & Water Barrier Demand by Product, 2014, 2019, 2024, 2029, &2034 (million dollars
- Table | Annual Infrastructure Air & Water Barrier Demand by Product, 2021 - 2028 (million dollars)
- Markets Overview
- Installation Trends
- Demand by Installation Method
- Table | Air & Water Barrier Demand by Installation Method, 2014, 2019, 2024, 2029, &2034 (million dollars)
- Table | Annual Air & Water Barrier Demand by Installation Method, 2021 - 2028 (million dollars)
- Self-Adhered Barriers
- Table | Self-Adhered Air & Water Barrier Demand by Product, 2014, 2019, 2024, 2029, &2034 (million dollars)
- Table | Annual Self-Adhered Air & Water Barrier Demand by Product, 2021 - 2028 (million dollars)
- Mechanically Attached Barriers
- Table | Mechanically Attached Air & Water Barrier Demand by Product, 2014, 2019, 2024, 2029, &2034 (million
- Table | Annual Mechanically Attached Air & Water Barrier Demand by Product, 2021 - 2028 (million dollars)
- Liquid-Applied Barriers
- Table | Liquid-Applied Air & Water Barrier Demand by Product, 2014, 2019, 2024, 2029, &2034 (million dollars
- Table | Annual Liquid-Applied Air & Water Barrier Demand by Product, 2021 - 2028 (million dollars)
- Demand by Installation Method
- Materials Trends
- Table | Air & Water Barrier Demand by Material, 2014, 2019, 2024, 2029, &2034 (million dollars)
- Table | Annual Air & Water Barrier Demand by Material, 2021 - 2028 (million dollars)
- Pricing & Inflation Impact
- Table | Selected Air & Water Barrier Product Prices, 2014, 2019, 2024, 2029, &2034 (dollars per square foot
- Table | Annual Selected Air & Water Barrier Product Prices, 2021 - 2028 (dollars per square foot & dollars p
- Study Scope
- Factors Impacting Air & Water Barrier Demand
- Building Construction Outlook
- Table | Building Construction Expenditures, 2014, 2019, 2024, 2029, &2034 (billion 2017 dollars & billion do
- Figure 4-1. Building Construction Expenditures, 2014 - 2034 (billion 2017 dollars)
- Importance of the Building Envelope
- Building Codes & Regulations
- Climate & Weather
- Sustainability Initiatives
- Recycling & Recycled Content
- Energy Efficiency
- Health Considerations
- Building Construction Outlook
- Waterproofing Products
- Scope & Product Description
- Figure 5-1. Waterproofing Products: Examples
- Products
- Demand by Product
- Table | Waterproofing Product Demand by Type, 2014, 2019, 2024, 2029, &2034 (million dollars & million squar
- Waterproofing Membranes (Sheets)
- Table | Waterproofing Membrane (Sheet) Demand by Market & Application, 2014, 2019, 2024, 2029, &2034 (millio
- Waterproofing Coatings
- Table | Waterproofing Coating Demand by Market & Application, 2014, 2019, 2024, 2029, &2034 (million dollars
- Demand by Product
- Materials Trends
- Table | Waterproofing Product Demand by Material, 2014, 2019, 2024, 2029, &2034 (million dollars)
- Installation Trends
- Table | Waterproofing Product Demand by Installation Method, 2014, 2019, 2024, 2029, &2034 (million dollars)
- Markets & Applications
- Table | Waterproofing Product Demand by Market & Application, 2014, 2019, 2024, 2029, &2034 (million dollars
- Below-Grade vs. Above-Grade
- Table | Waterproofing Product Demand: Above-Grade vs Below-Grade, 2014, 2019, 2024, 2029, &2034 (million dol
- New Product Development
- Suppliers
- Scope & Product Description
- Water-Resistive & Air Barriers
- Scope & Product Description
- Figure 6-1. Water-Resistive & Air Barriers: Product Examples
- Products
- Demand by Product
- Table | Water-Resistive & Air Barrier Demand by Product, 2014, 2019, 2024, 2029, &2034 (million dollars & mi
- Synthetic Underlayment
- Table | Synthetic Underlayment Demand by Market & Application, 2014, 2019, 2024, 2029, &2034 (million dollar
- Building (House) Wrap & Building Paper
- Table | Building (House) Wrap Demand by Market & Application, 2014, 2019, 2024, 2029, &2034 (million dollars
- Table | Building Paper Demand by Market & Application, 2014, 2019, 2024, 2029, &2034 (million dollars & mill
- Asphaltic Felt
- Table | Asphalt Felt Demand by Market & Application, 2014, 2019, 2024, 2029, &2034 (million dollars & millio
- Asphaltic Damp Proofing
- Table | Asphaltic Damp Proofing Demand by Market & Application, 2014, 2019, 2024, 2029, &2034 (million dolla
- Demand by Product
- Materials Trends
- Table | Water-Resistive & Air Barrier Demand by Material, 2014, 2019, 2024, 2029, &2034 (million dollars)
- Installation Trends
- Table | Water-Resistive & Air Barrier Demand by Installation Method, 2014, 2019, 2024, 2029, &2034 (million
- Markets & Applications
- Table | Water-Resistive & Air Barrier Demand by Market & Application, 2014, 2019, 2024, 2029, &2034 (million
- New Product Development
- Suppliers
- Scope & Product Description
- Flashing
- Scope & Product Description
- Figure 7-1. Flashing: Product Examples
- Products
- Demand by Product
- Table | Flashing Demand by Product, 2014, 2019, 2024, 2029, &2034 (million dollars & million linear feet)
- Rigid Flashing
- Table | Rigid Flashing Demand by Material, 2014, 2019, 2024, 2029, &2034 (million dollars & million linear f
- Flashing Tape
- Table | Flashing Tape Demand by Material, 2014, 2019, 2024, 2029, &2034 (million dollars & million linear fe
- Table | Flashing Tape Demand by Market & Application, 2014, 2019, 2024, 2029, &2034 (million dollars)
- Liquid Flashing
- Table | Liquid Flashing Demand by Market & Application, 2014, 2019, 2024, 2029, &2034 (million dollars & mil
- Demand by Product
- Materials Trends
- Table | Flashing Demand by Material, 2014, 2019, 2024, 2029, &2034 (million dollars)
- Installation Trends
- Table | Flashing Demand by Installation Method, 2014, 2019, 2024, 2029, &2034 (million dollars)
- Markets & Applications
- Table | Flashing Demand by Market & Application, 2014, 2019, 2024, 2029, &2034 (million dollars)
- New Product Development
- Suppliers
- Scope & Product Description
- Above-Grade Applications
- Application Scope & Description
- Product Trends
- Table | Above-Grade Air & Water Barrier Demand by Product, 2014, 2019, 2024, 2029, &2034 (million dollars)
- Materials Trends
- Table | Above-Grade Air & Water Barrier Demand by Material, 2014, 2019, 2024, 2029, &2034 (million dollars)
- Installation Trends
- Table | Above-Grade Air & Water Barrier Demand by Installation Method, 2014, 2019, 2024, 2029, &2034 (millio
- Market Trends (Residential, Commercial, &Infrastructure)
- Table | Above-Grade Air & Water Barrier Demand by Market & Application, 2014, 2019, 2024, 2029, &2034 (milli
- Applications
- Demand by Application
- Table | Above-Grade Air & Water Barrier Demand by Application, 2014, 2019, 2024, 2029, &2034 (million dollar
- Roofing
- Exterior Walls
- Windows & Doors
- Infrastructure
- Demand by Application
- Suppliers
- Below-Grade Applications
- Application Scope & Description
- Product Trends
- Table | Below-Grade Air & Water Barrier Demand by Product, 2014, 2019, 2024, 2029, &2034 (million dollars)
- Materials Trends
- Table | Below-Grade Air & Water Barrier Demand by Material, 2014, 2019, 2024, 2029, &2034 (million dollars)
- Installation Trends
- Table | Below-Grade Air & Water Barrier Demand by Installation Method, 2014, 2019, 2024, 2029, &2034 (millio
- Market Trends (Residential, Commercial, &Infrastructure)
- Table | Below-Grade Air & Water Barrier Demand by Market & Application, 2014, 2019, 2024, 2029, &2034 (milli
- Suppliers
- Industry Structure
- Key Findings & Industry Composition
- Market Share
- Figure 10-1. US Air & Water Barrier Market Share by Company, 2024 (billion dollars)
- Figure 10-2. US Air & Water Barrier Market: Leading Supplier, 2024
- Figure 10-3. US Air & Water Barrier Market: Second Leading Supplier, 2024
- Figure 10-4. US Air & Water Barrier Market: Third Leading Supplier, 2024
- Figure 10-5. US Air & Water Barrier Market: Fourth Leading Supplier, 2024
- Figure 10-6. US Air & Water Barrier Market: Fifth Leading Supplier, 2024
- Mergers & Acquisitions
- Table | Selected Mergers & Acquisitions
- List of Industry Participants
- Table | Selected Industry Participants
- Appendix
- Report Details
- Table | Relevant Industry Codes
- Table | Relevant HS Codes
- Definitions
- Abbreviations
- Table | Abbreviations & Acronyms Used in Study
- Freedonia Methodology
- Study-Specific Methodology
- Data Changes from Previous Version
- Sources
- Associations & Agencies
- Related Studies & Reports
- Macroeconomic Assumptions
- Economic Environment
- Table | Macroeconomic Indicators, 2014, 2019, 2024, 2029, &2034 (billion 2017 dollars)
- Demographics
- Table | Population & Households, 2014, 2019, 2024, 2029, &2034 (million persons)
- Building Construction
- Table | Building Construction Expenditures, 2014, 2019, 2024, 2029, &2034 (billion 2017 dollars & billion do
- Residential Building Construction
- Table | Residential Building Construction Expenditures, 2014, 2019, 2024, 2029, &2034 (billion 2017 dollars
- Residential Improvements & Repairs
- Table | Residential Improvement & Repair Expenditures, 2014, 2019, 2024, 2029, &2034 (billion 2017 dollars &
- Commercial Building Construction
- Table | Commercial Building Construction Expenditures, 2014, 2019, 2024, 2029, &2034 (billion 2017 dollars &
- Commercial Building Improvements & Repairs
- Table | Commercial Building Improvement & Repair Expenditures, 2014, 2019, 2024, 2029, &2034 (billion 2017 d
- Nonbuilding Construction Expenditures
- Table | Nonbuilding Construction Expenditures, 2014, 2019, 2024, 2029, &2034 (billion 2017 dollars & billion
- Housing Starts
- Table | New Housing Indicators, 2014, 2019, 2024, 2029, &2034
- Figure 11-1. New Housing Square Footage by Housing Type, 2009 - 2024
- Housing Stock
- Table | Housing Stock by Type, 2014, 2019, 2024, 2029, &2034 (million units)
- Figure 11-2. Housing Stock: Share by Year of Construction, 2024 (percent)
- Economic Environment
- Report Details
Air and water barriers are defined as products or materials that control the movement of air, water vapor, and/or water through roof decks, building envelopes, fenestration, foundations and exterior basement walls, and infrastructure.
In 2024, the market size in the US for air and water barriers was $7 billion.
In 2024, the air and water barrier market was led by five companies – Owens Corning, Carlisle Companies, DuPont, GAF Materials (Standard Industries), and CertainTeed (Saint-Gobain).
Related Reports

Global Industrial & Institutional Cleaning Chemicals

Global Adhesives & Sealants