US Coffee & Snack Shops Disposable Packaging & Serviceware
This Freedonia industry study analyzes the $2.4 billion US coffee and snack shops disposable packaging and serviceware. It presents historical demand data (2012, 2017 and 2022) and forecasts (2027) by product, and market (coffee shops, donut shops, ice cream and frozen yogurt shops, and other beverage and snack shops).
Free Sample Report
Request a free sample of this report and our team will email it to you.
Report Overview
Understand industry trends and successful business models
-
Get to know main industry players and suppliers
-
What kind of disposables are used and the changes happening in this area.
This Freedonia industry study analyzes the $2.4 billion US coffee and snack shops  disposable packaging and serviceware. It presents historical demand data (2012, 2017 and 2022) and forecasts (2027) by product (beverage packaging, serviceware, food cups, boxes and folding cartons, clamshells and two-piece containers, packaging bags and wraps, carryout bags, trays, and other food packaging), material (paper and paperboard, plastic, molded fiber, aluminum, and other materials), and market (coffee shops, donut shops, ice cream and frozen yogurt shops, and other beverage and snack shops). The study also evaluates company market share and competitive analysis on industry competitors including Dart Container, Pactiv Evergreen, Graphic Packaging, Georgia-Pacific and Novolex.
Featuring 62 tables and 18 figures – available in Excel and Powerpoint! Learn More
This report includes data from 2012-2027 in 5 year intervals and tables featuring year-by-year data for 2019-2026.
Demand for single-use products in the coffee and snack shop market is forecast to grow 4.3% annually to $3.0 billion in 2027, with growth coming from both increasing demand in units as well as higher prices:
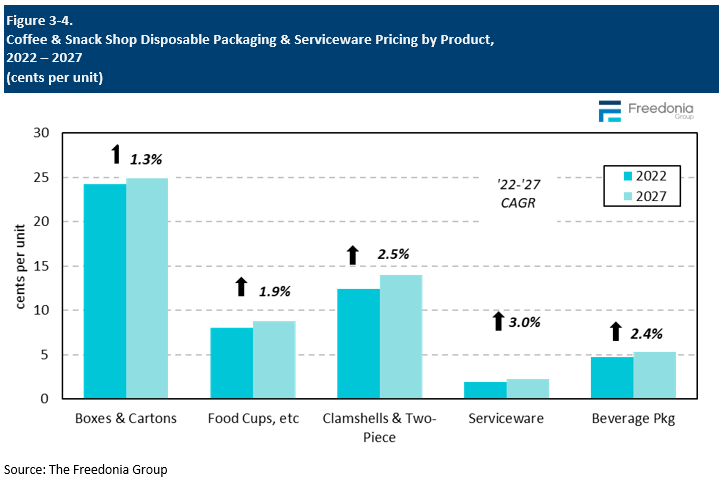
- Individual product prices will grow at a slower rate compared to the inflation-driven increases in 2021 and 2022; however, pricing will still increase going forward due to a shift in product mix toward more expensive products that are more sustainable or higher performing.
- Real growth will be supported by healthy underlying gains in the coffee and snack shop industry and expanding menu offerings. However, this will be offset by sustainability-driven efforts to reduce or eliminate excess packaging and serviceware use.
Coffee & Snack Shops Moving Toward More Sustainable Options
With more pressure from consumers and investors on leading companies to engage in sustainable practices, coffee and snack shops are making significant changes in the types and quantity of disposables that are used. End users are looking for ways to reduce or eliminate their use of plastic products such as straws, stirrers, and cups. For example, Dunkin’ has transitioned from foam cups to paper cups globally, and Starbucks recently met its target to have at least 20% recycled content in its hot cups by 2022. Starbucks has also been a leader in the move away from straws with the development of strawless lids.Reducing Demand for Conventional Plastics Fuels Demand for Alternatives
Due to concerns over their environmental impact, plastic products have been a key focus of changes in coffee and snack shop disposables use. Although paper is benefiting from the shift toward more sustainable packaging and taking share from plastic, other materials such as molded fiber and bioplastics are benefiting as well due to their high biodegradability levels. While this will support overall revenue increases due to sustainable packaging being more expensive, the focus is also on reducing the number of disposables in use, which will limit growth in unit terms.Starbucks Planning a Shift Toward Reusable Cups but Obstacles Could Slow Transition
Starbucks has long encouraged customers to use their own reusable cups by including small discounts on purchases. To further address growing sustainability concerns, the industry giant has announced plans to completely phase out single-use cups, aiming to serve all customers in the future with a mix of customers bringing their own cups/mugs combined with a deposit-based to-go option. While these efforts will limit growth in disposable cup demand to some degree over the next decade, it is unlikely that the company will be successful in eliminating the use of disposables due to customer backlash and logistical issues.Demand by Establishment Type
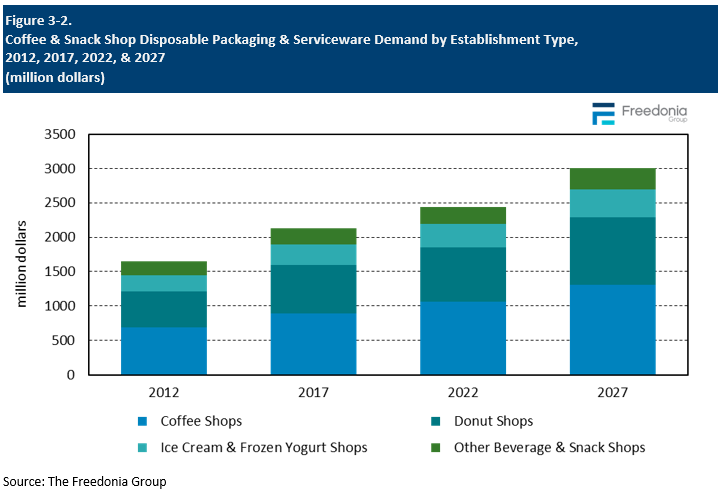
Restaurants in this market include limited menu establishments focused on specific items such as coffee, donuts, bagels, cookies, smoothies, and ice cream, as well as bakery cafés and general refreshment stands and kiosks offering a selection of beverages and snacks. These products often require specific packaging to facilitate on-the-go consumption.Demand for foodservice disposables in the coffee and snack shop market is expected to grow 4.3% per year to $3.0 billion in 2027, totaling 63.7 billion units. Demand will be driven by:
- solid growth in revenues and orders at these businesses
- expanding menus that increasingly incorporate a wider array of food options
- rising consumer interest in drive-thru and delivery orders from these outlets
- a shift toward higher value cups and lids to highlight specialty beverage products
- increasing demand for disposables made with more sustainable materials in outlets that have a reputation for environmental responsibility or cater to a large share of young customers
Trends in Materials Used
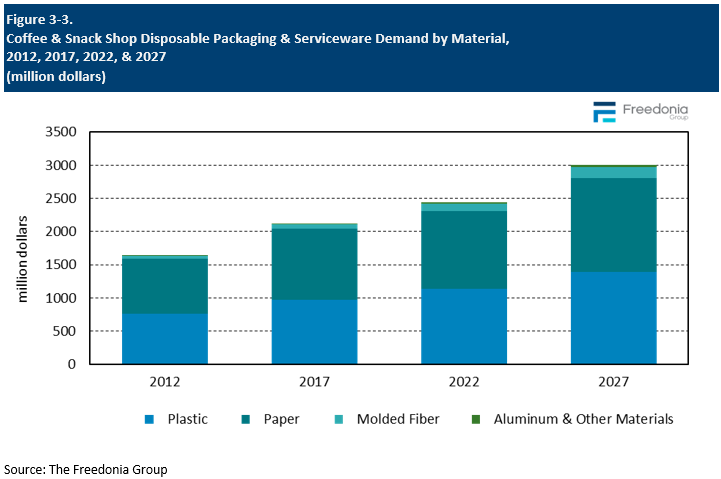
Materials used in coffee and snack shop disposables reflect their suitability for beverage cup applications and aesthetic food packaging, as well as growing environmental concerns. While paper cups have garnered a high share of the foodservice coffee market, cups made of bioplastics and plastic cups and lids that incorporate greater recycled content are gaining traction, as:- PLA is able to offer the same clarity as conventional rigid plastic.
- Coffee and snack shops look to attract younger customers and others interested in sustainability and therefore develop a reputation for environmental responsibility.
Food packaging is much more important for snack shops, where donut and bagel boxes and food cups for items such as ice cream are used more heavily.
Increasing concerns over sustainability have allowed materials such as paper and molded fiber to increase their share in unit terms at the expense of plastic. Aluminum is also being introduced as a sustainable option due to its ease of recycling and long-established methods for doing so.
Pricing Trends
The foodservice disposables industry is competitive, and product pricing is a significant factor in customer purchasing decisions. Factors influencing prices for single-use foodservice products include:
- raw material and labor costs
- shipping and transportation costs
- supply and demand balances
- customization, design, and printing costs
- changes in the material mix for various products
- increasing participation in and corresponding competition from products made of newer and more innovative materials
- import competition
- The price of plastic goods such as foam and rigid plastic cups, dinnerware, and containers is largely determined by the price of polystyrene, polypropylene, and polyethylene terephthalate (PET) resins, which, in turn, are affected by crude oil and natural gas prices.
- Paper bag, paper cup, and paperboard clamshell prices are linked to the price of bleached and unbleached kraft paper and paperboard, while napkin prices are tied to tissue paper prices.
Coffee & Snack Shop Industry Trends
Coffee and snack shops will face increased competition from other eating and drinking places, notably fast food and fast casual restaurants, which are incorporating more coffee and snack offerings to better meet changing consumer preferences.Coffee and snack shops impose competitive pressure on fast food businesses due to trends toward healthier eating and generational shifts in eating preferences. Fast food businesses are attempting to compete by remodeling their dining rooms to match the demand for a modern look, as well as offering limited-time special menu items and plant-based options.
These trends impact the types of foodservice disposables used:
- New menu items may require new packaging and possibly serviceware.
- Customers interested in ethically sourced food are more likely to value sustainable packaging.
- Hot and cold specialty beverages require cups and lids that display the item and secure the contents effectively and efficiently.
- Food items designed for eating on the go require wraps or scoop cups.
- Orders destined for delivery must be packaged to reduce spillage – boosting use of higher value lids – and, increasingly, are sealed to show customers that they have not been tampered with.
Demand for single-use products in the coffee and snack shop market is forecast to grow 4.3% annually to $3.0 billion in 2027, with growth coming from both increasing demand in units as well as higher prices:
- Individual product prices will grow at a slower rate compared to the inflation-driven increases in 2021 and 2022; however, pricing will still increase going forward due to a shift in product mix toward more expensive products that are more sustainable or higher performing.
- Real growth will be supported by healthy underlying gains in the coffee and snack shop industry and expanding menu offerings. However, this will be offset by sustainability-driven efforts to reduce or eliminate excess packaging and serviceware use.
Coffee & Snack Shops Moving Toward More Sustainable Options
With more pressure from consumers and investors on leading companies to engage in sustainable practices, coffee and snack shops are making significant changes in the types and quantity of disposables that are used. End users are looking for ways to reduce or eliminate their use of plastic products such as straws, stirrers, and cups. For example, Dunkin’ has transitioned from foam cups to paper cups globally, and Starbucks recently met its target to have at least 20% recycled content in its hot cups by 2022. Starbucks has also been a leader in the move away from straws with the development of strawless lids.Reducing Demand for Conventional Plastics Fuels Demand for Alternatives
Due to concerns over their environmental impact, plastic products have been a key focus of changes in coffee and snack shop disposables use. Although paper is benefiting from the shift toward more sustainable packaging and taking share from plastic, other materials such as molded fiber and bioplastics are benefiting as well due to their high biodegradability levels. While this will support overall revenue increases due to sustainable packaging being more expensive, the focus is also on reducing the number of disposables in use, which will limit growth in unit terms.Starbucks Planning a Shift Toward Reusable Cups but Obstacles Could Slow Transition
Starbucks has long encouraged customers to use their own reusable cups by including small discounts on purchases. To further address growing sustainability concerns, the industry giant has announced plans to completely phase out single-use cups, aiming to serve all customers in the future with a mix of customers bringing their own cups/mugs combined with a deposit-based to-go option. While these efforts will limit growth in disposable cup demand to some degree over the next decade, it is unlikely that the company will be successful in eliminating the use of disposables due to customer backlash and logistical issues.Demand by Establishment Type
Restaurants in this market include limited menu establishments focused on specific items such as coffee, donuts, bagels, cookies, smoothies, and ice cream, as well as bakery cafés and general refreshment stands and kiosks offering a selection of beverages and snacks. These products often require specific packaging to facilitate on-the-go consumption.Demand for foodservice disposables in the coffee and snack shop market is expected to grow 4.3% per year to $3.0 billion in 2027, totaling 63.7 billion units. Demand will be driven by:
- solid growth in revenues and orders at these businesses
- expanding menus that increasingly incorporate a wider array of food options
- rising consumer interest in drive-thru and delivery orders from these outlets
- a shift toward higher value cups and lids to highlight specialty beverage products
- increasing demand for disposables made with more sustainable materials in outlets that have a reputation for environmental responsibility or cater to a large share of young customers

Trends in Materials Used
Materials used in coffee and snack shop disposables reflect their suitability for beverage cup applications and aesthetic food packaging, as well as growing environmental concerns. While paper cups have garnered a high share of the foodservice coffee market, cups made of bioplastics and plastic cups and lids that incorporate greater recycled content are gaining traction, as:- PLA is able to offer the same clarity as conventional rigid plastic.
- Coffee and snack shops look to attract younger customers and others interested in sustainability and therefore develop a reputation for environmental responsibility.
Food packaging is much more important for snack shops, where donut and bagel boxes and food cups for items such as ice cream are used more heavily.
Increasing concerns over sustainability have allowed materials such as paper and molded fiber to increase their share in unit terms at the expense of plastic. Aluminum is also being introduced as a sustainable option due to its ease of recycling and long-established methods for doing so.

Pricing Trends
The foodservice disposables industry is competitive, and product pricing is a significant factor in customer purchasing decisions. Factors influencing prices for single-use foodservice products include:
- raw material and labor costs
- shipping and transportation costs
- supply and demand balances
- customization, design, and printing costs
- changes in the material mix for various products
- increasing participation in and corresponding competition from products made of newer and more innovative materials
- import competition
- The price of plastic goods such as foam and rigid plastic cups, dinnerware, and containers is largely determined by the price of polystyrene, polypropylene, and polyethylene terephthalate (PET) resins, which, in turn, are affected by crude oil and natural gas prices.
- Paper bag, paper cup, and paperboard clamshell prices are linked to the price of bleached and unbleached kraft paper and paperboard, while napkin prices are tied to tissue paper prices.

Coffee & Snack Shop Industry Trends
Coffee and snack shops will face increased competition from other eating and drinking places, notably fast food and fast casual restaurants, which are incorporating more coffee and snack offerings to better meet changing consumer preferences.Coffee and snack shops impose competitive pressure on fast food businesses due to trends toward healthier eating and generational shifts in eating preferences. Fast food businesses are attempting to compete by remodeling their dining rooms to match the demand for a modern look, as well as offering limited-time special menu items and plant-based options.
These trends impact the types of foodservice disposables used:
- New menu items may require new packaging and possibly serviceware.
- Customers interested in ethically sourced food are more likely to value sustainable packaging.
- Hot and cold specialty beverages require cups and lids that display the item and secure the contents effectively and efficiently.
- Food items designed for eating on the go require wraps or scoop cups.
- Orders destined for delivery must be packaged to reduce spillage – boosting use of higher value lids – and, increasingly, are sealed to show customers that they have not been tampered with.
- Executive Summary
- Figure 1-1. Coffee & Snack Shop Disposable Packaging & Serviceware Market
- About This Report
- Report Details
- Market Scope & Product Description
- Impact of COVID-19 Pandemic
- Table | Annual Coffee & Snack Shop Disposable Packaging & Serviceware Demand by Material, 2020 – 2023
- Table | Annual Coffee & Snack Shop Disposable Packaging & Serviceware Demand by Submarket, 2020 – 2023
- Figure 2-1. Annual Coffee & Snack Shop Disposable Packaging & Serviceware Demand, 2019 – 2024
- Overview
- Historical Market Trends
- Table | Coffee & Snack Shop Disposable Packaging & Serviceware Demand, 2012 – 2022
- Figure 3-1. Coffee & Snack Shop Disposable Packaging & Serviceware Demand, 2002 – 2022
- Market Overview
- Demand by Establishment Type
- Table | Coffee & Snack Shop Disposable Packaging & Serviceware Demand by Establishment Type, 2012, 2017, 202
- Table | Annual Coffee & Snack Shop Disposable Packaging & Serviceware Demand by Establishment Type, 2019 – 2
- Figure 3-2. Coffee & Snack Shop Disposable Packaging & Serviceware Demand by Establishment Type, 201
- Coffee Shops
- Table | Coffee Shop Disposable Packaging & Serviceware Demand by Product & Material, 2012, 2017, 2022, &2027
- Table | Annual Coffee Shop Disposable Packaging & Serviceware Demand by Product & Material, 2019 – 2026
- Donut Shops
- Table | Donut Shop Disposable Packaging & Serviceware Demand by Product & Material, 2012, 2017, 2022, &2027
- Table | Annual Donut Shop Disposable Packaging & Serviceware Demand by Product & Material, 2019 – 2026
- Ice Cream & Frozen Yogurt Shops
- Table | Ice Cream & Frozen Yogurt Shop Disposable Packaging & Serviceware Demand by Product & Material, 2012
- Table | Annual Ice Cream & Frozen Yogurt Shop Disposable Packaging & Serviceware Demand by Product & Materia
- Other Beverage & Snack Shops
- Table | Other Beverage & Snack Shop Disposable Packaging & Serviceware Demand by Product & Material, 2012, 2
- Table | Annual Other Beverage & Snack Shop Disposable Packaging & Serviceware Demand by Product & Material,
- Demand by Establishment Type
- Trends in Materials Used
- Demand by Material
- Table | Coffee & Snack Shop Disposable Packaging & Serviceware Demand by Material, 2012, 2017, 2022, &2027
- Table | Annual Coffee & Snack Shop Disposable Packaging & Serviceware Demand by Material, 2019 – 2026
- Figure 3-3. Coffee & Snack Shop Disposable Packaging & Serviceware Demand by Material, 2012, 2017, 2
- Paper & Paperboard
- Table | Coffee & Snack Shop Paper Disposable Packaging & Serviceware Demand by Product & Material, 2012, 201
- Table | Annual Coffee & Snack Shop Paper Disposable Packaging & Serviceware Demand by Product & Material, 20
- Plastic
- Table | Coffee & Snack Shop Plastic Disposable Packaging & Serviceware Demand by Product & Material, 2012, 2
- Table | Annual Coffee & Snack Shop Plastic Disposable Packaging & Serviceware Demand by Product & Material,
- Molded Fiber
- Table | Coffee & Snack Shop Molded Fiber Disposable Packaging & Serviceware Demand by Product, 2012, 2017, 2
- Table | Annual Coffee & Snack Shop Molded Fiber Disposable Packaging & Serviceware Demand by Product, 2019 –
- Aluminum & Other Materials
- Table | Coffee & Snack Shop Aluminum & Other Disposable Packaging & Serviceware Demand by Product & Material
- Table | Annual Coffee & Snack Shop Aluminum & Other Disposable Packaging & Serviceware Demand by Product & M
- Demand by Material
- Pricing Trends
- Table | Coffee & Snack Shop Disposable Packaging & Serviceware Pricing by Product, 2012, 2017, 2022, &2027
- Table | Annual Coffee & Snack Shop Disposable Packaging & Serviceware Pricing by Product, 2019 – 2026
- Figure 3-4. Coffee & Snack Shop Disposable Packaging & Serviceware Pricing by Product, 2022 – 2027
- Historical Market Trends
- Factors Impacting Foodservice Disposables Demand
- Coffee & Snack Shop Industry Trends
- Table | Coffee & Snack Shop Revenues, 2012, 2017, 2022, &2027
- Table | Annual Coffee & Snack Shop Revenues, 2019 – 2026
- Regulations
- State Regulations
- Federal Regulations
- Disposable Product Bans
- PFAS (Perfluoroalkyl & Polyfluoroalkyl Substances)
- Sustainability Initiatives
- Key Sustainability Factors
- Foodservice Industry Efforts
- Single-Use Product Supplier Efforts
- Consumer Preferences
- General Environmental Attitudes
- Table | Consumer Attitudes on Recycling & Environmental Responsibility by Age Group, 2022
- Table | Consumer Attitudes on Recycling & Environmental Responsibility by Gender, 2022
- Table | Consumer Attitudes on Recycling & Environmental Responsibility by Annual Household Income Bracket, 2
- Packaging Environmental Attitudes
- Table | Consumer Attitudes on Single-Use Plastics by Gender, Age Group, Urban vs. Rural Setting, Annual Hous
- Packaging & Serviceware Use
- Table | Consumer Attitudes About Restaurant Use of Sustainable Disposables by Gender, Age Group, Urban vs. R
- Table | Willingness to Pay More for Sustainable Disposables by Gender, Age Group, Urban vs. Rural Setting, A
- Table | Consumer Awareness of Disposable Material by Gender, Age Group, Urban vs. Rural Setting, Annual Hous
- General Environmental Attitudes
- Coffee & Snack Shop Industry Trends
- Coffee & Snack Shop Disposable Product Trends
- Demand by Product
- Table | Coffee & Snack Shop Disposable Packaging & Serviceware Demand by Product, 2012, 2017, 2022, &2027
- Table | Annual Coffee & Snack Shop Disposable Packaging & Serviceware Demand by Product, 2019 – 2026
- Figure 5-1. Coffee & Snack Shop Disposable Packaging & Serviceware Demand by Product, 2012, 2017, 20
- Beverage Packaging (Cups, Lids, Sleeves, Bag-in-Box, Pouches)
- Demand by Product
- Table | Coffee & Snack Shop Disposable Beverage Packaging Demand by Product, 2012, 2017, 2022, &2027
- Table | Annual Coffee & Snack Shop Disposable Beverage Packaging Demand by Product, 2019 – 2026
- Table | Coffee & Snack Shop Disposable Beverage Packaging Demand by Product, 2012, 2017, 2022, &2027
- Table | Annual Coffee & Snack Shop Disposable Beverage Packaging Demand by Product, 2019 – 2026
- Figure 5-2. Coffee & Snack Shop Beverage Packaging: Examples
- Beverage Cups
- Beverage Lids & Domes
- Sleeves
- Bag-In-Box & Pouches
- Demand by Product
- Serviceware (Dinnerware, Napkins, Straws, Drink Carriers)
- Table | Coffee & Snack Shop Serviceware Demand by Product, 2012, 2017, 2022, 2027, &2032
- Table | Annual Coffee & Snack Shop Serviceware Demand by Product, 2019 – 2026
- Table | Coffee & Snack Shop Serviceware Demand by Product, 2012, 2017, 2022, 2027, &2032
- Table | Annual Coffee & Snack Shop Serviceware Demand by Product, 2019 – 2026
- Figure 5-3. Coffee & Snack Shop Serviceware: Examples
- Food Cups, Scoops, Tubs, Buckets, &Pails
- Table | Coffee & Snack Shop Food Cup, Scoop, Tub, Bucket, &Pail Demand by Product, 2012, 2017, 2022, &2027
- Table | Annual Coffee & Snack Shop Food Cup, Scoop, Tub, Bucket, &Pail Demand by Product, 2019 – 2026
- Figure 5-4. Coffee & Snack Shop Food Cups, Scoops, Tubs, Buckets, &Pails: Examples
- Boxes & Folding Cartons
- Table | Coffee & Snack Shop Box & Folding Carton Demand by Product, 2012, 2017, 2022, &2027
- Table | Annual Coffee & Snack Shop Box & Folding Carton Demand by Product, 2019 – 2026
- Figure 5-5. Coffee & Snack Shop Boxes and Folding Cartons: Examples
- Clamshells & Two-Piece Containers
- Table | Coffee & Snack Shop Clamshell & Two-Piece Container Demand by Product, 2012, 2017, 2022, &2027
- Table | Annual Coffee & Snack Shop Clamshell & Two-Piece Container Demand by Product, 2019 – 2026
- Figure 5-6. Coffee & Snack Shop Clamshells: Examples
- Figure 5-7. Coffee & Snack Shop Two-Piece Containers: Examples
- Packaging Bags & Wraps
- Table | Coffee & Snack Shop Packaging Bags & Wraps Demand by Product, 2012, 2017, 2022, &2027
- Table | Annual Coffee & Snack Shop Packaging Bags & Wraps Demand by Product, 2019 – 2026
- Figure 5-8. Coffee & Snack Shop Packaging Bags & Wraps: Examples
- Carryout (Take-Out) Bags
- Table | Coffee & Snack Shop Carryout (Take-Out) Bag Demand by Material, 2012, 2017, 2022, &2027
- Table | Annual Coffee & Snack Shop Carryout (Take-Out) Bag Demand by Product, 2019 – 2026
- Figure 5-9. Coffee & Snack Shop Carryout Bags: Examples
- Packaging Trays & Other Food Packaging
- Table | Coffee & Snack Shop Packaging Tray & Other Food Packaging Demand by Product, 2012, 2017, 2022, &2027
- Table | Annual Coffee & Snack Shop Tray & Other Food Packaging Demand by Product, 2019 – 2026
- Figure 5-10. Coffee & Snack Shop Trays & Other Food Packaging: Examples
- Demand by Product
- Leading Coffee & Snack Shop Trends in Disposable Packaging & Serviceware
- Coffee & Snack Shop Industry Leaders
- Figure 6-1. Coffee & Snack Shop Revenues Market Share by Company, 2022
- Coffee & Snack Shop Industry Leaders
- Industry Structure & Leading Suppliers
- Industry Composition
- Market Share
- Figure 7-1. Coffee & Snack Shop Single-Use Product Market Share by Company, 2022
- Mergers & Acquisitions
- Table | Selected Mergers & Acquisitions
- Appendix
- Scope
- Table | Relevant Industry Codes
- Definitions
- Freedonia Methodology
- Study-Specific Methodology
- Sources
- Associations & Agencies
- Related Studies & Reports
- Macroeconomic Assumptions
- Economic Environment
- Table | Macroeconomic Indicators, 2012, 2017, 2022, &2027
- Demographic Trends
- Table | Population & Households, 2012, 2017, 2022, &2027
- Consumer Spending
- Table | Personal Consumption Expenditures & Retail Sales, 2012, 2017, 2022, &2027
- Retail Sales
- Table | Nondurable Goods Retail Sales, 2012, 2017, 2022, &2027
- Economic Environment
- Scope
Growth for disposable packaging and serviceware products used in coffee and snack shops will be supported by growth in unit sales as demand continues to recover from the sharp drop caused by the COVID-19 pandemic and rising prices across all products due to a shift to higher-value products.
Demand for disposable packaging and serviceware products used in coffee and snack shops is forecast to increase 4.3% per year to $3.0 billion in 2027.
Beverage packaging – including cups, lids, sleeves, bag-in-box packaging, and fillable pouches – is the most significant category of single-use products in the coffee and snack shop foodservice industry.
Fast growth in both units and market value is expected in newer product categories, such as to-go beverage pouches and bag-in-box packaging for coffee, targeted at catering and carryout/delivery markets, as these formats offer an economical way to package large quantities of liquid.