Aquaculture: US Market Trends & Opportunities Report
This report examines the US aquaculture industry, with analysis of farm-raised finfish and shellfish production trends from 2019 through forecasts to 2030. Consumer demographics, perceptions, motivations, and purchasing behavior are analyzed as they relate to fish and shrimp consumption, health priorities, GLP-1 engagement, retail versus foodservice channels, and attitudes toward farm-raised seafood.
Free Sample Report
Request a free sample of this report and our team will email it to you.
Report Overview
Retail Resilience, Protein Priorities, and Production Shifts Redefine US Aquaculture
Even as foodservice stabilizes, structurally higher retail demand and protein-driven eating habits are reshaping how farm-raised seafood is produced, marketed, and sold. This report examines how cost pressures, GLP-1 adoption, and digital grocery are altering the industry’s trajectory through 2030.
Key Themes Covered in this Report:
- GLP-1 & the Protein Effect: How appetite control drugs and high-protein priorities are influencing fish and shrimp consumption frequency—and what that means for portion sizes, product mix, and messaging.
- Tariffs, Trade, and Cost Volatility: How import reliance, feed costs, and shifting trade policy are affecting pricing dynamics and competitive positioning for domestic producers.
- Digital & Direct-to-Consumer Expansion: How online grocery, subscription seafood, and temperature-controlled shipping are expanding market reach beyond traditional coastal strongholds.
US production for aquaculture is forecast to rise x.x% per year to xxx million metric tons in 2030. Market advances will be supported by rising remodeling activity in developed countries and global advances in new housing construction.
Structural Retail Gains Offset Foodservice Volatility
US aquaculture production over the 2019-2025 period was shaped less by a collapse in seafood demand than by pronounced channel disruption and cost volatility. While pandemic-related restrictions severely constrained foodservice activity in 2020, retail seafood engagement expanded materially and remains structurally elevated relative to pre-pandemic levels.
Fresh and frozen fish and seafood penetration increased from 45% of adults in 2019 to a peak of 53% in 2021, before stabilizing at 49% in 2025 – four percentage points above its pre-pandemic baseline. Importantly, the lift was not limited to light or occasional users. The share of adults consuming four or more pounds of seafood in the past 30 days rose from 18% in 2019 to 21% in 2021 and held at approximately 20% through 2025. This indicates that deeper engagement accompanied broader adoption.
In contrast, full-service restaurant visitation declined sharply in 2020 before recovering by 2022. The inverse movement between retail seafood consumption and sit-down dining activity underscores a clear channel reallocation effect rather than a structural decline in demand. Pandemic-era production volatility therefore reflected disruption in market pathways, not erosion of underlying consumer interest in seafood.
Economic Headwinds Continue to Shape Seafood Purchasing Behavior
Although demand fundamentals remain stable, seafood purchasing is increasingly shaped by inflation, tariff uncertainty, and price sensitivity. Rising input costs, trade policy volatility, and broader food price inflation have pressured both producers and consumers. Households report heightened concern about food costs and are more actively managing grocery budgets.
Seafood’s positioning as a nutrient-dense protein offers resilience, but consumers are demonstrating greater selectivity across species, formats, and price tiers. Frozen and value-added products benefit from both price transparency and shelf-life advantages, particularly in digital channels where cost comparison is immediate and convenient.
Trade Policy and Cost Volatility Add Pressure to Seafood Supply Chains
Trade policy and tariff uncertainty continue to contribute to cost volatility in the U.S. seafood market. The category remains heavily reliant on imports – particularly for shrimp, salmon, tilapia, and other staple species – making wholesale and retail pricing sensitive to changes in duty structures and geopolitical developments. Tariff exposure extends beyond finished seafood to packaging, logistics, and processing inputs, amplifying variability across the supply chain.
While domestic aquaculture offers supply proximity and production control advantages, it is not insulated from elevated feed, energy, labor, and compliance costs. As a result, trade policy functions less as a one-time disruption and more as an ongoing source of pricing uncertainty, complicating forecasting and contract planning for both importers and domestic producers.
Aquaculture: US Market Trends & Opportunities Report Details
| Current Total Market Size | 665,000 metric tons |
| Forecast Total Market Growth Rate | -13.3% per year through 2030 |
| Historical Period | 2015-2025 |
| Forecast Period | 2025-2030 |
| Units Covered | Metric tons |
| Countries Individually Covered | United States |
| Products | Finfish (Catfish, salmon & trout, tilapia, other finfish) Shellfish (Oysters, clams, shrimp & prawns, other shellfish) |
| Areas of installation | Kitchen, bathroom, other areas of installation |
| Additional Elements | GLP-1 Engagement with Fish & Shrimp Consumption Frequency, Heavy User Analysis (4+ Pounds, Past 30 Days), Retail vs. Foodservice Channel Reallocation Trends, Online Grocery & Direct-to-Consumer Seafood Purchasing Behavior, Consumer Attitudes Toward Farm-Raised vs. Wild-Caught Seafood, Clean Label & High-Protein Priority Segmentation, Food Safety & Antibiotics Perception Analysis, Tariff & Trade Exposure Assessment, Inflation & “Trading Down” Impact on Seafood Purchasing, Demographic Deep Dives (Generation, Income, Urbanicity, Presence of Children), Near-Term Production Outlook & Five-Year Forecast by Product. |
Health, Protein Priorities, & the GLP-1 Effect
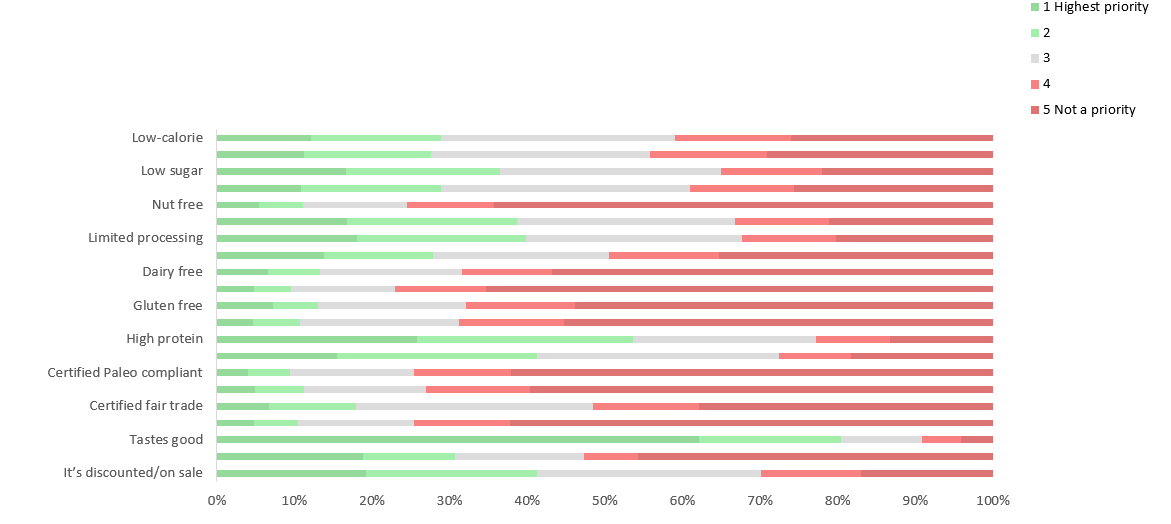
More consumers prioritize protein quality, simple ingredients, and foods that support long-term wellness. Farm-raised fish and shrimp align well with these “protein-first” habits because they deliver a lean, versatile center-of-plate option that fits a wide range of eating styles, from calorie-conscious diets to performance and active lifestyle routines. The report examines how consumers define “healthy food,” what characteristics matter most when making food choices, and how those priorities translate into seafood purchasing and consumption behavior.
A key focus is the growing role of GLP-1 and other weight-loss medications in shaping food demand. These therapies can change appetite and portion behavior, influencing how frequently consumers choose certain proteins and what formats feel most convenient or satisfying. Rather than treating GLP-1 as a simple demand headwind, the analysis looks at how the trend may shift preference toward efficient, nutrient-dense foods and reinforce interest in cleaner labels, transparent sourcing, and products that communicate clear functional benefits. For aquaculture producers and marketers, this creates opportunities to refine messaging around protein density, ease of preparation, and product trust factors such as quality, safety, and farming practices.
What This Means for Aquaculture Strategy
As consumer expectations evolve, competitive advantage increasingly depends on more than supply reliability. Brands that win will reduce perceived risk at the point of purchase, especially online, by making benefits easy to understand in seconds. That means clearer positioning around nutrition and protein, packaging and labeling that support transparency, and formats that meet convenience needs (including frozen, value-added, and portioned options). The report connects these consumer trends to actionable implications for product development, retail execution, and communication strategies that can help aquaculture suppliers capture growth even in a price-sensitive environment.
Aquaculture Report Scope
Aquaculture: US Market Trends & Opportunities examines the structure, performance, and outlook of the US aquaculture production industry, with a focus on farm-raised finfish and shellfish. The report analyzes domestic production volumes, species composition, input cost dynamics, trade flows, regulatory influences, and competitive positioning within the broader US seafood supply chain.
The study evaluates how economic pressures, trade policy, input costs (including feed, labor, energy, and capital equipment), environmental regulations, and consumer demand trends shape production decisions and long-term industry viability. While consumer attitudes and purchasing patterns are examined to contextualize demand-side forces, the primary emphasis of the report is on aquaculture production rather than retail sales performance.
Analysis draws largely on three primary sources of consumer data:
- The February 2026 Packaged Facts National Online Consumer Survey, which includes a panel of 1,500 US adults (aged 18 and older) balanced to the national population on primary demographic measures such as age group, gender, geographic region, marital status, race/ethnicity, presence or absence of children in the household, and household income. The September 2025, March 2025, November 2024, August 2024, May 2024, March 2024, November-December 2023, September-October 2023, and May 2023 surveys (each with a panel of 1,500 adults) are also used.
- The Fall 2025 MRI-Simmons National Study, which is a booklet-based survey conducted across tens of thousands of respondents (aged 18+) selected by address-based sampling to represent a statistically accurate cross-section of the US adult population. Prior year surveys are used for trending purposes.
- The International Food Information Council Foundation’s 2025 Food & Health Survey provides valuable insight into consumers’ perspectives on food purchasing decisions along with insights on other pertinent topics.
Other primary and secondary sources consulted for this report include trade associations; company reports; environmental and animal-welfare advocacy groups; third-party credentialing organizations; and trade, business, and consumer publications.
This report covers US aquaculture production intended for human food consumption. It includes both freshwater and marine farming operations and examines production by species category.
Finfish are segmented by the following product forms:
- catfish
- salmon and trout
- tilapia
- other finfish such as bass, carp, and cod
Shellfish are segmented by the following product forms:
- oysters
- clams
- shrimp and prawns
- other shellfish such as lobsters, mussels, squid, and octopus
Excluded from the scope of this report are:
- wild-caught fisheries production
- seafood retail sales data as a primary measure of market size
- revenue from aquaculture products sold by restaurants and other foodservice entities (such as cafeterias, bars, and caterers)
- ornamental fish, baitfish, or non-food aquaculture applications
- aquatic plants (e.g., seaweed)
- Executive Summary
- Structural Retail Gains Offset Foodservice Volatility
- Economic Headwinds Continue to Shape Seafood Purchasing Behavior
- Trade Policy and Cost Volatility Add Pressure to Seafood Supply Chains
- Digital Channels Reshape Retail Pathways
- Protein Efficiency and “Better-For-You” Priorities Strengthen Seafood’s Position
- Production Outlook: Stability With Structural Shifts
- Scope
- Recent Historical Trends
- Highlights
- Rising Costs & Supply Pressures
- Many Consumers Are Concerned about Inflation & Rising Food Prices
- Table | Consumer Concerns about Rising Food Prices, 2023 – 2026 (% of consumers)
- Table | Month-to-Month Changes in Consumer Price Index (CPI) for All Food Items, 2022 – 2025 (percent change
- Tariffs to Further Inflate US Seafood Prices
- Rising Seafood Prices Impact Consumer Behavior
- Cutting Back on Household Expenses
- Table | Consumer Spending on “Extras”, 2023 – 2025 (percent of consumers)
- Many Consumers Are Concerned about Inflation & Rising Food Prices
- Foodservice Disruption & Channel Reallocation
- Retail Seafood Penetration Strengthened During the Pandemic
- Table | Fresh & Frozen Fish & Seafood Consumption (Past 30 Days) 2015 – 2025 (percent of adults 21+)
- Intensity Increased Among Core Consumers
- Table | Heavy Fresh & Frozen Fish & Seafood Consumption (4+ Pounds, Past 30 Days) 2015 – 2025 (percent of ad
- Sit-Down Dining Collapsed in 2020 Before Recovering
- Table | Family Restaurant/Steakhouse Visitation (Past 30 Days), 2015 – 2025 (percent of adults 21+)
- Retail Seafood Penetration Strengthened During the Pandemic
- Overview & Market Trends
- Highlights
- Online Grocery & Direct-to-Consumer Channels
- Digital Expansion & Evolving Seafood Purchase Pathways
- Table | Online Grocery Purchasing (Past 30 Days), 2019 – 2025 (percentage of adults 21+)
- From In-Store Selection to Digital Convenience
- Growth of Frozen, Subscription, &Value-Added Formats
- Expanded Access & Niche Exploration
- Implications for Aquaculture
- Digital Expansion & Evolving Seafood Purchase Pathways
- Health, Nutrition, &Consumer Priorities
- Healthy Food
- Protein Matters More Than Ever
- GLP-1 Medications
- Table | Frequency of Fish Consumption by GLP-1 Engagement, 2026 (percent of consumers)
- Table | Frequency of Shrimp Consumption by GLP-1 Engagement, 2026 (percent of consumers)
- Table | Priority Placed on High-Protein Foods by GLP-1 Engagement, 2026 (percent of consumers)
- Table | Priority Placed on Low-Calorie Foods by GLP-1 Engagement, 2026 (percent of consumers)
- Table | Priority Placed on Clean Label Foods by GLP-1 Engagement, 2026 (percent of consumers)
- Food Safety, Antibiotics, and Quality Expectations
- Table | Consumers Opinions on Seafood, 2026 (percent of consumers)
- Food Labeling, Transparency, &Consumer Trust
- Regulatory & Oversight Context
- Dietary Patterns & Restrictions
- Table | Food Priorities for Consumers, 2026 (percent of consumers)
- Aquaculture As a Path To Health & Wellness
- Perceptions of Farm-Raised Seafood
- Table | Consumers Opinions on Farm-Raised Seafood, 2026 (percent of consumers)
- Market Size and Forecast
- Highlights
- Market Outlook Through 2030
- Table | Aquaculture Production, 2019 – 2030 (thousand metric tons and percent change)
- Aquaculture Production
- Historical Trends by Product
- Table | Aquaculture Production by Product, 2019 – 2025 (thousand metric tons)
- Forecast by Product
- Table | Aquaculture Production by Product, 2025, 2026E, 2027P – 2030P (thousand metric tons)
- Historical Trends by Product
- Opportunities to Target Particular Demographic Groups
- Older Consumers
- Higher-Income Households
- Families with Children
- Health-Oriented Consumers
- Younger Adults & Emerging Consumers
- Consumer Demographics
- Highlights
- Frequency of Purchases of Aquaculture Products
- Trends by Gender
- Table | Frequency of Fish Consumption by Gender, 2025 (percent of consumers)
- Table | Frequency of Shrimp Consumption by Gender, 2025 (percent of consumers)
- Trends by Age Bracket
- Table | Frequency of Fish Consumption by Age Bracket, 2026 (percent of consumers)
- Table | Frequency of Shrimp Consumption by Age Bracket, 2025 (percent of consumers)
- Trends by Generation
- Table | Frequency of Fish Consumption by Generation, 2026 (percent of consumers)
- Table | Frequency of Shrimp Consumption by Generation, 2026 (percent of consumers)
- Patterns Based on Household Income
- Table | Frequency of Fish Consumption by Household Income, 2026 (percent of consumers)
- Table | Frequency of Shrimp Consumption by Household Income, 2026 (percent of consumers)
- Urban, Suburban, &Rural Consumers
- Table | Frequency of Fish Consumption by Urban, Suburban, and Rural Living, 2026 (percent of consumers)
- Table | Frequency of Shrimp Consumption by Urban, Suburban, and Rural Living, 2026 (percent of consumers)
- Presence of Children in the Household
- Table | Frequency of Fish Consumption by Presence of Children in the Household, 2026 (percent of consumers)
- Table | Frequency of Shrimp Consumption by Presence of Children in the Household, 2026 (percent of consumers
- Interests Among GLP-1 Users
- Table | Frequency of Fish Consumption by Interest in & Use of GLP-1 Medications, 2026 (percent of consumers)
- Table | Frequency of Purchases of Shrimp by Interest in & Use of GLP-1 Medications, 2026 (percent of consume
- Trends With Clean Label Dieters
- Table | Frequency of Fish Consumption by Priority Placed on Clean Label Foods, 2026 (percent of consumers)
- Table | Frequency of Shrimp Consumption by Priority Placed on Clean Label Foods, 2026 (percent of consumers)
- Trends With High Protein Diets
- Table | Frequency of Fish Consumption by Priority Placed on a High Protein Diet, 2026 (percent of consumers)
- Table | Frequency of Shrimp Consumption by Priority Placed on a High Protein Diet, 2026 (percent of consumer
- Trends by Gender
Consumers are placing greater emphasis on high-quality protein, simple ingredients, and foods that support overall wellness. The report explores how these priorities affect fish and shrimp consumption patterns, perceptions of farm-raised seafood, and opportunities for aquaculture producers to strengthen positioning around nutrition, transparency, and product trust.
GLP-1 adoption is influencing how consumers think about portion size, protein quality, and calorie efficiency. The report analyzes how engagement with these medications correlates with fish and shrimp consumption frequency, high-protein priorities, and clean label preferences, highlighting strategic implications for aquaculture producers and retailers.
The report evaluates production shifts between finfish and shellfish, cost pressures tied to feed and trade policy, evolving consumer health priorities, and the rise of digital purchasing channels. Together, these forces define the competitive landscape and long-term outlook for US aquaculture.