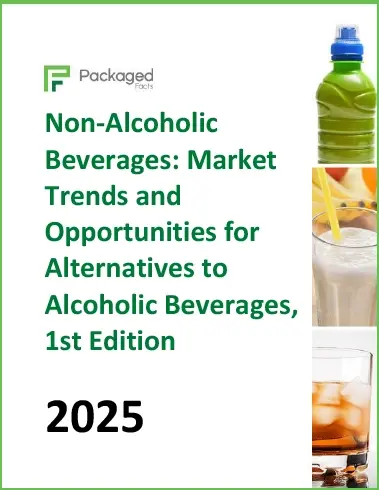
Non-Alcoholic Beverages: Market Trends and Opportunities for Alternatives to Alcoholic Beverages, 1st Edition
Non-Alcoholic Beverages is packed with insights about consumer trends, behavior, and motivations to help food and beverage producers, retailers, packaging firms, employers, and investors gauge consumer perspectives and find areas for growth in a competitive market.
Free Sample Report
Request a free sample of this report and our team will email it to you.
Report Overview
Mindful Mixology: Non-Alcoholic Alternatives Are Shaking Up the Alcoholic Beverage Industry
Forget Dry January – the “sober curious” movement is fundamentally reshaping how more people socialize and unwind. Millions of people are consciously choosing to sip on sophisticated non-alcoholic alternatives to alcohol. This shift is not just for health but also part of a larger trend of redefining indulgence and social connection. Packaged Facts’ new report uncovers the many reasons behind changing consumer preferences and forecasts 18.5% annual growth in this dynamic market.
Key Themes Addressed in this Report
- the effects of the “Sober Curious” movement and “Dry January”
- “Zebra Striping”, a moderation tactic in which consumers switch between alcoholic beverages and NA alternatives during drinking occasions
- growing cannabis consumption and shifting preferences among younger adults
- potential effects of semaglutide medications such as Ozempic
- new product innovation and drinking occasion growth opportunities
- how packaging and branding can make nonalcoholic drinking less obvious and more subtle for consumers reluctant to explain their choice of these beverages
Growing awareness of the negative health consequences associated with alcohol consumption – including increased risks of cancer, cardiovascular disease, and mental health issues – is a significant driver of change, leading to more people embracing non-alcoholic alternatives to alcoholic beverages. A multitude of factors beyond health concerns are also leading to people cutting back on or entirely avoiding alcohol, which can make non-alcoholic alternatives much more appealing.
- Some may not like to drink alcohol because they dislike its taste or short-term effects.
- Dealing with addiction issues, either personally or within a family or friend group, can cause individuals to abstain from alcohol completely.
- Many people who drink alcoholic beverages engage in “zebra striping”, a moderation tactic that involves switching between alcoholic beverages and non-alcoholic alternatives during consumption occasions.
At the forefront of the evolving landscape for alcoholic beverages and non-alcoholic alternatives is the “sober curious” movement. This movement involves consciously choosing to reduce or eliminate alcohol consumption, and adherence is often driven by a desire for improved health and well-being. Sober curious lifestyles encompass a spectrum of behaviors, from mindful moderation to temporary periods of full abstention. Initiatives such as “Dry January”, an example of the latter, contribute to this broader trend by encouraging individuals to examine their relationships with alcohol and explore alternative habits. The “sober curious” movement is a key driver for seeking out sophisticated and flavorful non-alcoholic beverages that can seamlessly integrate into social settings.
Demographic shifts are also playing a crucial role, as research indicates that younger adults are less likely than their predecessors to drink alcoholic beverages. This cultural shift has significant implications for the alcoholic beverage industry, necessitating a focus on developing appealing non-alcoholic and lower-alcohol options to cater to an evolving consumer base.
Of course, innovations continue to drive sales as well. New product releases that taste better and are available in expanded flavor varieties appeal to more consumer preferences. Additionally, newer types of packaging and brand stories make the products more attractive to consumers, especially those who might not be interested in discussing with others their reasons for choosing a non-alcoholic beverage.
Retail sales of non-alcoholic alternatives to alcoholic beverages in the scope of this report are segmented by type:
- Non-Alcoholic Beer
- Non-Alcoholic Ready-To-Drink Cocktails/Mocktails
- Non-Alcoholic Spirits
- Non-Alcoholic Wine
With a focus on “what’s next” and current consumer trends, Non-Alcoholic Beverages: Market Trends and Opportunities for Alternatives to Alcoholic Beverages is packed with insights about consumer trends, behavior, and motivations to help food and beverage producers, retailers, packaging firms, employers, and investors gauge consumer perspectives and find areas for growth in a competitive market.
Non-Alcoholic Beverages: Market Trends and Opportunities for Alternatives to Alcoholic Beverages delivers actionable predictions and recommendations designed to guide producers, retailers, and investors in making business decisions by providing data and insights about consumers who drink non-alcoholic alternatives to alcoholic beverages and alcoholic beverage consumption trends.
Non-Alcoholic Beverages Report Scope
Non-Alcoholic Beverages: Market Trends and Opportunities for Alternatives to Alcoholic Beverages is the go-to source for a complete understanding of the US retail market for non-alcoholic alternatives to alcoholic beverages. This report combines Packaged Facts’ extensive monitoring of the food and beverage market with proprietary surveys and evaluates current trends and future directions for marketing and retailing, along with consumer patterns during the pandemic, during the inflation area, and across the broader food and beverage market.
This Packaged Facts report analyzes the dynamics of the current landscape of the non-alcoholic beverage market. Consumers who drink non-alcoholic beverage alternatives and alcoholic beverage drinking habits are examined. Trends including online grocery shopping, reasons for diet and lifestyle choices, and retail and marketing trends are also investigated.
Historical market size for the retail non-alcoholic beverage market is provided from 2019 through 2024. Forecasts for this market are provided from 2025 through 2029 and 2034.
The reasons for and implications of shifts in consumer perception and behavior are analyzed in the context of future market opportunities.
Major topics including the “sober curious” movement, cannabis use, “zebra striping”, and functional beverage trends are examined, with particular focus on growth opportunities for non-alcoholic beverages.
The report has dozens of tables showcasing numerical survey data on consumer demographics and psychographics and numerous marketing photographs. This report goes in-depth on historical trends that have affected the food and beverage market.
Non-Alcoholic Beverages Report Methodology
The information contained in Non-Alcoholic Beverages: Market Trends and Opportunities for Alternatives to Alcoholic Beverages was developed from primary and secondary research sources. Primary research includes interviews with food and beverage market experts; participation in and attendance at food industry events; and extensive internet canvassing.
Primary research also includes national online consumer polls of U.S. adult consumers (age 18+) conducted on an ongoing basis by Packaged Facts to analyze attitudes of consumers and their relevant food and beverage preferences.
Survey data from MRI-Simmons are used to analyze the demographics and psychographics of consumers and usage trends for alcoholic beverages and NA beer.
Supplementing Packaged Facts’ exclusive surveys is analysis from the International Food Information Council Foundation’s (IFIC) 2024 Food and Health Survey is used to provide useful information on consumer behavior and perspectives on food purchasing decisions and diet and lifestyle choices.
Report Coverage for Non-Alcoholic Beverages: Market Trends and Opportunities for Alternatives to Alcoholic Beverages
| Current Total Market Size | $750 million |
| Forecast Total Market Growth Rate | 18.5% CAGR from 2024-2029 |
| Historical Period | 2019-2024 |
| Forecast Period | 2025-2029, 2034 |
| Units Covered | US dollars (current) |
| Countries Individually Covered | United States |
| Products | Non-Alcoholic Beer, Non-Alcoholic Ready-to-Drink Cocktails/Mocktails, Non-Alcoholic Spirits, Non-Alcoholic Wine |
| Markets | Consumer - Retail |
| Point Where Data is Measured | Retail Point of Sale (including both e-commerce and conventional brick-and-mortar) |
| Additional Elements | Non-Alcoholic Beverage Consumer Demographic Analysis, Psychographics of Non-Alcoholic Beverage Consumers, Near Term Analysis of Market Size and Demand, Projections for the Next Decade, Growth Opportunities, Changes in Feelings of Wellbeing, Online Shopping Habits, Snacking Habits, Concerns About Pricing, Related Bar & Restaurant Trends, Functional Beverage Trends |
Key Participants Driving Trends in the Non-Alcoholic Beverages Market
| AB InBev | |
| Athletic Brewing | |
| Diageo | |
| Heineken | |
| J. Lohr Vineyards | |
| Luna Bay | |
| Molson Coors | |
| Noughty | |
| Nowadays | |
| Parch | |
| Spiritless | |
| Surely | |
| Sutter Home | |
| Three Spirit |
- Executive Summary
- Motivations for Embracing Non-Alcoholic Alternatives to Alcoholic Beverages
- The "Sober Curious" Movement: A Catalyst for Change
- Generational Shifts: Younger Adults Opting for Sobriety
- The Effects of Growing Cannabis Consumption
- Future Outlook and Growth Opportunities
- Scope
- Recent Historical Trends
- Highlights
- Rising Prices: From Supply Chain Crunches to Inflation
- Table | Consumer Concerns about Rising Food Prices, 2021 – 2024 (percent of consumers)
- Rising Prices Impact Consumer Behavior
- Cutting Back on Household Expenses
- Table | Consumers Cutting Back on Household Expenses in the Last 12 Months, 2022 (percent of consumers)
- Table | Types of Household Expenses Cut Back on in the Last 12 Months, 2022 (percent of consumers)
- Table | Consumer Spending on "Extras", 2023 – 2024 (percent of consumers)
- Private Labels Are More Desirable as Prices Rise
- The Vast Majority of Consumers Have Noticed the Rising Cost of Food, and Many Are Changing Their Pur
- Consumers Find Price More Important for Food Purchase Decisions in 2024
- Snacking and Healthy Eating Habits
- Trends in 2022
- Changes to Snacking Habits in 2023
- Table | Current Snacking Activity Compared to Pre-Pandemic Levels, 2023 (percent of consumers)
- Increasing Use of Semaglutide Medications Can Change Snacking and Eating Habits
- Online Grocery Shopping and Convenience Food Options
- The COVID-19 Pandemic Was the Jumpstart the Online Grocery Market Needed
- Impact on the Alcoholic Beverage and NA Beverage Market
- Activity in 2023 and 2024
- Table | Consumer Use of Food Ordering Methods in the Last 12 Months, 2024 (percent of consumers)
- Table | Consumer Frequency of Food Ordering Methods in the Last 3 Months, 2024 (percent of consumers who hav
- Table | Consumer Frequency of Food Ordering Habits Now Compared to 12 Months Ago, 2024 (percent of consumers
- Table | Consumer Expected Changes to the Frequency of Food Ordering Habits in the Next 12 Months, 2024 (perc
- Work Habits
- Food and Beverage Trends in the Context of Changes to Work
- Changes to Work Patterns Continued in 2022
- Working from Home in 2023
- Table | Ability to Work from Home and Frequency of Remote Work, 2023 (percent of consumers)
- Table | Working at a Co-Working Space or Working from Home, 2023 (percent of consumers)
- Table | Consumer Rating of Experiences Working at a Co-Working Space or Working from Home, 2023 (percent of
- Table | Consumer Opinions on Working at a Co-Working Space or Working from Home, 2023 (percent of employed c
- Work Habits in 2024
- Table | Where Time Is Spent during a Typical Work Week, 2024 (percent of employed consumers)
- Personal Feelings of Wellbeing
- Reporting Negative Mental States in 2023
- Continuing Mental and Physical Health Effects in 2024
- Table | Current Feelings on Mental and Physical Symptoms Compared to "Normal" or Preferred Level, 2024 (perc
- Stress Levels and Impact on Food/Beverage Consumption
- Overview and Market Trends
- Highlights
- Definition
- Reasons for Consumption and Abstention: The Role of Alcoholic Beverages and Non-Alcoholic Alternativ
- The "Sober Curious" Movement and "Dry January"
- Young Adults Are Less Likely to Drink Alcoholic Beverages than in Previous Generations
- Growing Awareness of the Risks of Alcohol Consumption
- Increasing Legalization and Social Acceptance of Cannabis
- "Zebra Striping" Alternates Drinking Alcohol and NA Options – Targeting Consumers Who Also Drink Alc
- Increasing Use of Semaglutide Medications Can Change Drinking Habits
- The Look of NA Beverage Options Is Key
- Bar and Restaurant Trends in NA Beverage Alternatives
- Increased Stocking of Non-Alcoholic Beer, Spirits, and Wine
- Elevated and Sophisticated Mocktails
- Focus on Fresh and Seasonal Ingredients
- Plant-Based and Innovative Bases
- "Better-For-You" Takes on the Classics
- Occasion-Specific and Themed Offerings
- Mindful and Intuitive Eating Extends to Drinking
- Definition
- Motivations for Practicing Mindful Eating
- Frequency of Feelings and Behaviors Associated with Mindful and Intuitive Eating Patterns
- Relationship with Food
- "Better-for-You" Trends
- Clean Label
- Unrefined Sugar
- Sugar-Free/No Sugar Added Products and Alternative Sweeteners
- Organic and Non-GMO Products
- Functional Beverage Trends
- Functional Beverage Definition
- Relaxation and Stress Relief
- "Superfoods", "Adaptogens", and "Food as Medicine"
- Hemp and CBD
- Brain Health, Cognitive Function (Nootropics), and Mental Focus
- Energy and Sports Functions
- Immunity Boosting and Gut Health
- Market Size
- Highlights
- Scope
- NA Beverage Retail Sales
- Table | NA Beverage Alternative Retail Sales by Type, 2019-2024 (million dollars)
- Table | NA Beverage Alternative Retail Sales by Type, 2024, 2025P-2029P, 2034P (million dollars)
- Growth Opportunities
- Flavor and Ingredient Innovation
- Consumer Demographics
- Highlights
- Alcoholic Beverage Drinking Habits
- Table | Frequency of Typical Alcohol Drinking Habits by Age Bracket, 2024 (percent of consumers)
- Table | Consumption of Alcoholic Beverages in the Last 6 Months by Product Type, 2024 (percent of consumers)
- Table | Consumption of Alcoholic Coolers & Seltzers/Number of Drinks in the Last 30 Days, 2024 (percent of c
- Table | Location of Alcoholic Beverage Purchases in the Last 6 Months, 2024 (percent of consumers purchasing
- Table | Location of Alcoholic Beverage Consumption in the Last 30 Days, 2024 (percent of consumers consuming
- Table | Amount Spent on Alcoholic Beverages in Last 30 Days, 2024 (percent of consumers)
- Interest in "Sober Curious" Lifestyles and "Dry January"
- Consumption of No Alcohol Beverages
- Table | Last Consumption of Low/No-Alcohol Beverages, 2024 (percent of consumers)
- Table | Consumption of No Alcohol/Low-Alcohol Beer, 2024 (percent of consumers)
- Table | Consumption of No Alcohol/Low-Alcohol Beer by Brand in the Last 6 Months, 2024 (percent of consumers
- NA Beverage Alternatives Most Popular Among Younger Consumers
- Table | Consumption of NA Beverage Alternatives in the Last Month by Age Bracket, 2024 (percent of consumers
- Table | Consumption of Alcoholic Beverages and NA/LA Beer in the Last Six Months by Age Bracket, 2024 (perce
- Men Are Somewhat More Likely to Report Drinking NA Beverages in the Last Month
- Table | Consumption of NA Beverage Alternatives in the Last Month by Gender, 2024 (percent of consumers)
- Table | Consumption of Alcoholic Beverages and NA/LA Beer in the Last Six Months by Gender, 2024 (percent of
- NA Beverage Consumption Varies Across Income Groups
- Table | Consumption of NA Beverage Alternatives in the Last Month by Household Income Bracket, 2024 (percent
- Table | Consumption of Alcoholic Beverages and NA/LA Beer in the Last Six Months by Household Income Bracket
- Married/Partnered Consumers and Presence of Children in the Household
- Table | Consumption of NA Beverage Alternatives in the Last Month by Presence of Children in HH and Marriage
- Table | Consumption of Alcoholic Beverages and NA/LA Beer in the Last Six Months by Presence of Children in
- Consumers Living in the Northeast and West Most Interested in NA Beverages
- Table | Consumption of NA Beverage Alternatives in the Last Month by US Region, 2024 (percent of consumers)
- Table | Consumption of Alcoholic Beverages and NA/LA Beer in the Last Six Months by US Region, 2024 (percent
- NA Beverage Alternatives More Popular Among Urban Consumers
- Table | Consumption of NA Beverage Alternatives in the Last Month by Rural, Suburban, and Urban Environment,
- Table | Consumption of Alcoholic Beverages and NA/LA Beer in the Last Six Months by Age Bracket, 2024 (perce
- Consumption of NA Beverages Higher Among Non-White Consumers
- Table | Consumption of NA Beverage Alternatives in the Last Month by Race/Ethnicity, 2024 (percent of consum
- Table | Consumption of Alcoholic Beverages and NA/LA Beer in the Last Six Months by Race/Ethnicity, 2024 (pe
- LGBT Consumers Are Somewhat More Likely to Drink NA Beer
- Table | Consumption of Alcoholic Beverages and NA/LA Beer in the Last Six Months by LGBT Affiliation, 2024 (
- College Students Are Key for NA Beverage Alternatives
- Table | Consumption of NA Beverage Alternatives in the Last Month by Educational Attainment, 2024 (percent o
- Table | Consumption of Alcoholic Beverages and NA/LA Beer in the Last Six Months by Educational Attainment,
- Plant-Forward Eating Correlates with Use of NA Drinks
- Table | Consumption of NA Beverage Alternatives in the Last Month by Primary Diet/Eating Philosophy, 2024 (p
- Table | Consumption of Alcoholic Beverages and NA/LA Beer in the Last Six Months by Primary Diet/Eating Phil
- Online Grocery Shoppers More Likely to Consume NA Beverage Alternatives
- Table | Consumption of NA Beverage Alternatives in the Last Month by Use of Online Grocery Websites in the L
- Table | Consumption of Alcoholic Beverages and NA/LA Beer in the Last Six Months by Use of Online Grocery De
- Consumer Psychographics
- Highlights
- Factors That Could Convince Consumers to Try or Increase Consumption of NA Beverage Alternatives
- Table | Features that Would Make Consumers More Likely to Try NA Beverages or Have Them More Often, 2024 (pe
- Table | Features that Would Make Consumers More Likely to Try NA Beverages or Have Them More Often by Age Br
- Consumer Opinions on Alcoholic and NA Beverages
- Table | Consumer Agreement on Statements about Alcoholic and Non-Alcoholic Beverages, 2024 (percent of consu
- Table | Consumer Agreement on Statements about Alcoholic and Non-Alcoholic Beverages by Age Bracket, 2024 (p
- Occasions for NA Beverage Alternatives
- Table | Occasions When Consumers Might Seek Out NA Beverage Alternatives, 2024 (percent of consumers)
- Organic Food Purchases
- Table | Consumer Agreement on Statements about Organic Food Purchases, 2024 (percent of consumers)
- Food Processing and Clean Ingredients and Labels
- Table | Consumer Agreement on Statements about Clean Ingredients, Food Processing, and Labels, 2024 (percent
- Snacking Behavior
- Table | Statements about Snacking, 2024 (percent of consumers who agree)
- Grocery Shopping and Meal Planning Habits
- Table | Consumer Agreement on Statements about Grocery Shopping and Eating Habits, 2024 (percent of consumer
- Cooking Skills
- Table | Consumer Confidence with Cooking Skills, 2024 (percent of consumers)
- Table | Consumer Rating of Cooking Skills, 2024 (percent of consumers)
- Consumer Attitudes on Food and Health
- Attitudes about Carbs, Proteins, and Whole/Unprocessed Foods
- Table | Statements about Sweeteners, Calories, and Sugar, 2024 (percent of consumers who strongly agree)
- Preferences for Indulgent Foods
- Table | Indulgent Food Preferences among Those Who Have Had Alcoholic Beverages or NA/LA Beer in the Last 6
- Cooking Attitudes
- Table | Cooking Attitudes among Those Who Have Had Alcoholic Beverages or NA/LA Beer in the Last 6 Months, 2
- Attitudes on Convenience Foods, Being Busy, and Stress
- Table | Attitudes on Those Who Have Had Alcoholic Beverages or NA/LA Beer in the Last 6 Months, 2024 (percen
- Nutrition and Health Attitudes
- Table | Nutrition and Health Attitudes among Those Who Have Had Alcoholic Beverages or NA/LA Beer in the Las
- Attitudes on Premium Foods and Paying for Food
- Table | Attitudes on Premium Foods and Paying for Food among Those Who Have Had Alcoholic Beverages or NA/LA
- Openness to New Food Experiences
- Table | Attitudes on Openness to New Food Experiences among Those Who Have Had Alcoholic Beverages or NA/LA
- Attitudes about Carbs, Proteins, and Whole/Unprocessed Foods