Report Overview
Highlights: 3 Fencing Market Trends and Statistics
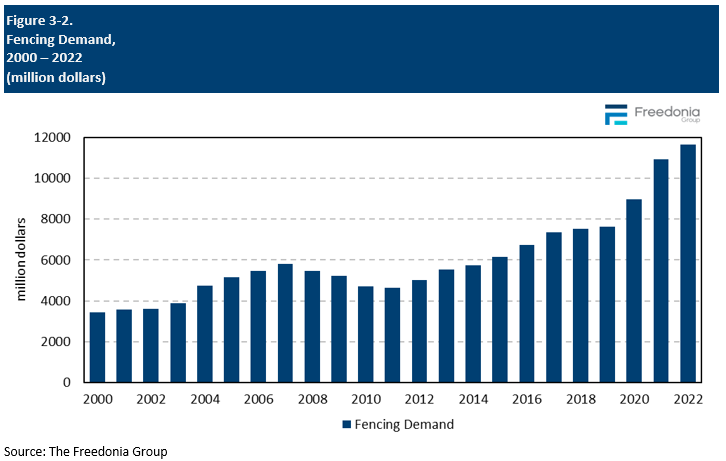
- US fencing market size reached a valuation of $11.7 billion in 2022, with the majority of supply coming from domestic manufacturers.
- US fencing market growth is expected to follow a gradual rise of 1.2% annually—a notable slowdown compared to the previous period.
- Demand for fencing varies by material. Metal fencing products will continue to increase their fencing market share due to minimal upkeep and longer lifespans.
The Latest Fencing Industry Analysis
This Freedonia industry study analyzes the $12 billion US market for fencing. It presents historical demand data (2012, 2017, and 2022) and forecasts (2027 and 2032) as well as annual data for years 2019-2026. Unit demand and value demand data is shown for fencing by material (metal, wood, plastic, composite, concrete), product type (chain link fencing, wire fencing, ornamental fencing, pipe fencing, privacy fencing, post & rail fencing, split rail fencing, vinyl fencing, hdpe fencing, polypropylene fencing, concrete block fencing, precast concrete fencing, spray-in-place fencing, bamboo fencing, brick fencing, reed fencing, stone fencing, twig fencing) and market (new, improvement, and repair demand in both residential and commercial applications). The study also evaluates fencing market share and competitive analysis on industry competitors including Barrette Outdoor Living, Master Halco, MAT Holdings, Merchants Metal, Universal Forest Products.
Featuring 148 tables and 65 figures – available in Excel and Powerpoint! Learn More
Read our blog about vinyl fencing
US fencing demand is forecast to grow 1.2% annually to $12.4 billion in 2027, a significant deceleration from the 2017-2022 period, when market value was boosted by a surge in fencing prices in 2021 and 2022 that resulted from a combination of supply chain issues and rising raw material costs. In real terms, demand is expected to grow nearly 1.0% per year, with a rebound in commercial building construction and nonbuilding construction activity providing opportunities for fence sales; however, a decline in new housing construction will restrain further gains.
Metal Remains Most Popular Fencing Material
Metal fencing products will continue to increase their share of the fencing industry as home and business owners continue to favor fencing materials that require less upkeep and have longer lifespans:
-
Demand for ornamental fencing will rise as homeowners increasingly prefer the appearance, greater durability, and added security of a metal fence over traditional wood fences. In addition, ornamental fencing sales will be boosted by the commercial market, where facilities such as hotels and resorts are choosing more aesthetically pleasing security fencing.
-
Chain link fencing will benefit from a rebound in commercial building and nonbuilding construction, as this fencing is often favored for locations such as industrial buildings and airports, where durability and ease of maintenance take precedence over more costly fencing with better aesthetics.
Plastic Fencing Gains Momentum
Use of plastic fencing surged during the pandemic as shortages and supply chain issues made other fencing materials, such as wood and metal, more difficult to obtain. Building on this momentum, plastic fencing will continue to expand its share of demand as more companies enter the vinyl fencing market, making the product more readily available and leading to greater price competition. Plastic fencing’s popularity will also be boosted by new vinyl fencing products that offer a more wood-like aesthetic, which is especially popular for residential buildings.
Historical Fencing Market Trends
Demand for fencing can vary considerably from year to year, determined by several factors primarily related to trends in construction spending and new home sales. Specific factors impacting annual fencing demand include:
-
the size and age of the US housing stock
-
trends in average property size
-
levels of housing starts, particularly in the single-family housing segment, and existing home sales
-
the number and types of commercial buildings erected or repaired in any given year
-
levels of home renovation activity
-
interest rates – low interest rates may encourage home and business owners to take out lines of credit to fund new fence installations or repairs
In addition, a number of other variables can affect the fencing industry in a particular year or over a short-term period, such as:
-
weather conditions, especially outbreaks of severe weather – such as hurricanes and tropical storms, tornadoes, and winter storms – that can cause widespread damage to fences
-
changes and modifications to state and local building codes
-
changes in the price of raw materials (e.g., metal, plastic, lumber) that can cause the per-square cost of fencing materials to increase or decrease sharply
-
consumer preferences for stay-at-home activities such as gardening, swimming, or outside entertaining, which may require fencing for security or privacy
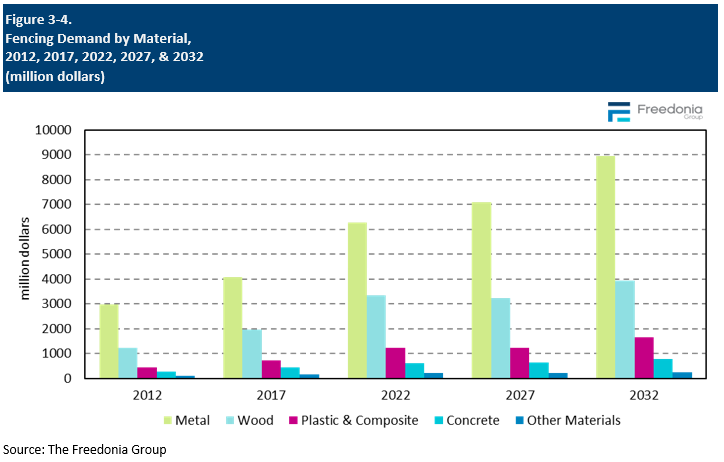
Fencing Market Growth by Material Type
Fencing market value is forecast to increase 1.2% per year to $12.4 billion in 2027, a significant deceleration from the previous period, when supply chain issues and soaring raw material costs caused prices to spike significantly in 2021 and 2022.
Growth will stem from real gains in linear feet, an increase in popularity for more durable and higher cost fencing materials, and a shift in product mix toward more expensive plastic and composite fencing:
-
Metal accounts for the majority of market value and is expected to register the largest absolute gains, driven by the increased adoption of higher priced ornamental metal fencing as an alternative to chain link or wood fences. Ornamental fencing has become increasingly preferred for its durability and low maintenance, coupled with its better aesthetics compared to other types of metal fencing.
- Wood fencing will lose market share in real terms due to competition with ornamental metal fencing and vinyl fencing, and market value will be hindered by the stabilizing price of lumber.
- Plastic and composite fencing will register little growth in market value. While plastic and composite fencing will increase their share in volume terms – especially in the residential market where plastic-based fencing is replacing wood based on its durability and improving aesthetics – the decline in price per linear foot will hinder market value.
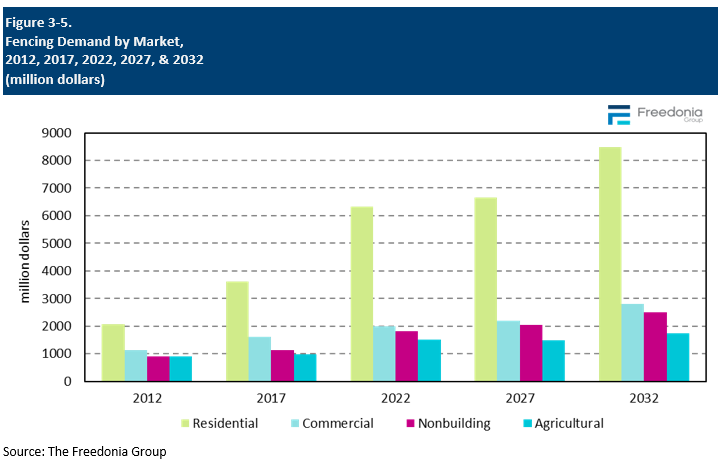
Fencing Market Growth Across Various Applications
The residential market accounted for over half of all fencing market value in 2022 and has been a driver of growth for the industry over the past five years due to:
Going forward, growth in residential applications will arise from increasing improvement and repair activity, as a short-term decline in the construction of new housing will negatively affect residential building construction.
Growth in the commercial market will be driven by a rebound in commercial building construction, while market value will be supported by changing preference for high-end ornamental metal and chain link fences for these buildings.
Demand in the smaller agricultural market will be negatively affected by the moderation in prices during the forecast period. Further losses will be avoided by a changing product mix toward higher value fencing materials and ongoing, albeit slow, growth in linear feet terms.
Demand in the nonbuilding market will be supported by healthy increases in infrastructure spending as the construction of roads and highways often includes new or replacement fencing. Low-cost utilitarian materials are commonly specified in this market because fencing serves primarily functional – rather than aesthetic – purposes, which can hinder gains in value terms.
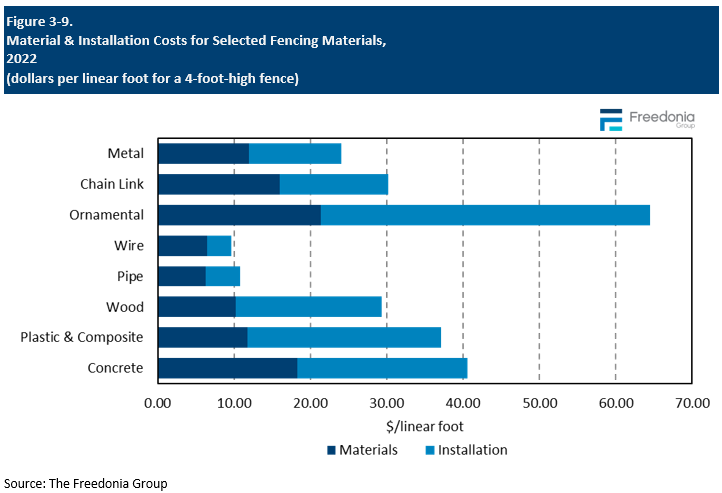
Fencing Installation Costs
Throughout this study, the market for fencing is discussed in terms of the dollar value of sales as measured at the manufacturers’ level. These values do not take into account the cost of installation services provided by distributors, retailers, or fencing contractors.
Manufacturers’ prices alone can be somewhat misleading when gauging the final installed cost of fencing from a buyer’s perspective, since installation costs can vary widely among materials:
-
For a niche product such as stone fencing, the cost of stone may be a small fraction of the installed cost of the fence, given that an experienced stonemason is required to construct a high-quality fence.
-
While the initial material cost for plastic fencing is less than that for high-end wood privacy fencing, it is more difficult and time-consuming to install, resulting in a higher final installed cost.
The installation costs of a particular fence depend on such factors as:
-
fencing material used
-
design, style, and shape of the fence
-
ease of cutting and assembling the fencing
-
number of gates
-
use of automatic operators for the gates
Generally, ornamental metal fencing is the costliest type to install; it can be more than twice as expensive as other metal fence types because of the intricacies of installation.
The installation cost of vinyl fencing is typically higher than some other materials due to the nature of vinyl, which can make the process more labor-intensive and extend the amount of time spent on installation. For wooden fences, postholes can be dug first and then filled with the posts, and the placement of these holes does not have to be exact as wood will expand or contract over time and after long-term exposure to the elements. However, for vinyl fencing, the spaces between postholes must be carefully determined, as the material is much less affected by temperature changes.