Skip navigation
Reports & Analysis Custom Research Research Subscriptions
Sign In / Create Account Cart
  • Reports & Analysis
  • Custom Research
  • Research Subscriptions

Resources

  • Analyst Buzz
  • Press Releases
  • Blog
  • Resources & Downloads

The Freedonia Group

  • Contact
  • About
  • Our Staff
  • Help Center
  • Career Opportunities
Freedonia Market Research Freedonia Group US Foodservice Single-Use Products

US Foodservice Single-Use Products

Industry Reports, United States

Report Overview

Foodservice is markedly different than before the pandemic. Learn more about changes.

  • Kinds of packaging used

  • Sustainability conversions 

The US market for foodservice packaging and serviceware continues to face unprecedented disruption, with the lingering impact of the COVID-19 pandemic, sustainability initiatives, and longer running market trends all combining to escalate changes in market size, product formats, and materials.

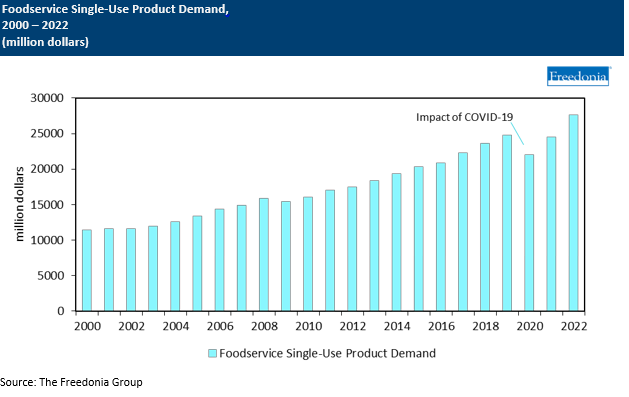
Demand for foodservice single-use products is forecast to grow 3.8% annually to $33.2 billion in 2027. However, this growth rate hides several opposing underlying trends:
  • Growth in individual product prices will moderate – or even decline – from inflation-driven highs in 2021 and 2022, but this will be offset by a shift in the product mix toward higher value materials and packaging formats.
  • Real growth will be supported by continued recovery in the restaurant industry and key noncommercial foodservice markets such as sports and entertainment venues and catering. Demand will be further boosted by the popularity of takeout and delivery, especially from full-service establishments that have historically not been large users of disposables.
  • Growth in units will be restrained by sustainability-driven efforts to reduce or eliminate excess packaging and serviceware use.
Featuring 196 tables and 69 figures – available in Excel and Powerpoint! Learn More

Table of Contents

    • $323.44

    • $470.35

      • $323.44

      • $323.44

      • $323.44

      • $323.44

      • $323.44

    • $751.51

      • $323.44

      • $323.44

      • $323.44

      • $323.44

      • $323.44

      • $323.44

        • $323.44

        • $323.44

    • $641.68

      • $382.89

        • $323.44

        • $323.44

        • $323.44

        • $323.44

        • $323.44

        • $323.44

        • $323.44

      • $323.44

        • $323.44

        • $323.44

        • $323.44

        • $323.44

      • $323.44

        • $323.44

        • $323.44

        • $323.44

    • $2,026.19

      • $323.44

      • $323.44

      • $1,033.94

        • $323.44

        • $323.44

        • $323.44

        • $323.44

        • $323.44

        • $323.44

        • $323.44

        • $323.44

      • $323.44

        • $323.44

        • $323.44

        • $323.44

      • $323.44

        • $323.44

        • $323.44

    • $1,799.27

      • $323.44

      • $323.44

      • $614.95

        • $323.44

        • $323.44

        • $323.44

        • $323.44

        • $323.44

      • $323.44

      • $323.44

      • $323.44

      • $323.44

    • $1,881.85

      • $323.44

      • $1,531.01

        • $323.44

        • $323.44

        • $323.44

        • $323.44

        • $323.44

        • $323.44

        • $323.44

        • $323.44

      • $323.44

      • $323.44

    • $796.29

      • $323.44

      • $505.92

        • $323.44

        • $323.44

        • $323.44

      • $323.44

      • $323.44

      • $323.44

    • $968.59

      • $323.44

      • $809.37

        • $323.44

        • $323.44

        • $323.44

        • $323.44

        • $323.44

      • $323.44

    • $1,441.82

      • $323.44

      • $1,087.83

        • $323.44

        • $323.44

        • $323.44

        • $323.44

        • $323.44

      • $323.44

      • $323.44

    • $1,237.30

      • $323.44

      • $534.16

        • $323.44

        • $323.44

        • $323.44

      • $538.04

        • $323.44

        • $323.44

        • $323.44

        • $323.44

      • $323.44

    • $1,293.53

      • $323.44

      • $965.43

        • $323.44

        • $323.44

        • $323.44

        • $323.44

        • $323.44

        • $323.44

      • $323.44

      • $323.44

    • $714.43

      • $323.44

      • $323.44

      • $412.49

        • $323.44

        • $323.44

        • $323.44

      • $323.44

    • $1,867.86

      • $323.44

      • $1,480.91

        • $323.44

        • $323.44

        • $323.44

        • $323.44

        • $323.44

        • $323.44

        • $323.44

        • $323.44

      • $323.44

      • $323.44

    • $2,026.45

      • $323.44

      • $323.44

      • $1,354.18

        • $323.44

        • $323.44

        • $323.44

        • $323.44

        • $323.44

        • $323.44

      • $421.16

        • $323.44

        • $323.44

    • $1,219.33

      • $323.44

      • $323.44

      • $408.70

        • $323.44

        • $323.44

        • $323.44

      • $614.59

        • $323.44

        • $323.44

        • $323.44

        • $323.44

    • $769.12

      • $323.44

      • $323.44

      • $323.44

      • $323.44

    • $1,250.57

      • $323.44

      • $323.44

      • $323.44

      • $323.44

      • $323.44

      • $323.44

      • $323.44

      • $323.44

      • $323.44

        • $281.25

        • $281.25

        • $281.25

        • $281.25

      • $630.20

        • $323.44

        • $323.44

        • $323.44

        • $342.18

Play Video: Foodservice Single Use Products

Sustainability Drives Market Value Growth & Materials Evolution But Limits Unit Gains

The foodservice industry historically considered the environmental impact of its packaging use, but cost and performance often were more important factors in purchasing decisions.

However, over the past decade sustainability has become the leading factor for choosing single-use products, especially for high-profile national chains. This has resulted in:
  • a strong push toward using higher priced alternatives – such as paper, molded fiber, and bioplastics – to conventional plastics
  • efforts to eliminate certain types of disposables altogether, including small plastics (such as straws and stirrers) and products made from plastic foam

Search for the Perfect Material Continues; All Materials Have Pros & Cons

Foodservice companies and their suppliers continue to search for the ideal packaging material, a product that offers good sustainability and performance at a low price. While conventional plastics continue to dominate sales due to their low cost and good performance (and a growing focus on recycled content), the fastest industry growth is expected in newer materials such as molded sugarcane and PHA bioplastics. These new materials offer good performance, sustainability, and increasingly competitive pricing.

Carryout & Off-Premises Dining Continues at High Levels

Limited service restaurants have long had a strong takeout business, but over the past decade there has been a marked shift in focus for all restaurants – including full-service establishments – to off-premise sales, either through drive-thru, curbside, or delivery operations. Shifts away from dining inside restaurants are significantly expanding the number of disposables needed per order, leading to the development of improved products designed to deliver food safely while retaining its quality and presentation.

Historical Market Trends

At its broadest level, demand for single-use foodservice products is driven by trends in foodservice revenue, which is an indicator of the number of meals eaten away from home and the amount spent on those meals. Growth in foodservice activity in turn is dependent on a number of macroeconomic and demographic factors including:
  • Trends in food consumption and the mix of food eaten at home versus away from home
  • The health of the overall economy and levels of disposable income, which impact the ability of consumers to spend on more expensive restaurant meals (compared to home cooking)
  • Changes in the population mix, especially in terms of age cohorts (such as young adults) that are likely to eat out more often
  • Trends in consumer spending, including spending on travel and entertainment, which impact foodservice sales at hotels and sports and recreation venues
  • Student enrollment levels and trends in school lunch programs
Beyond these basic macroeconomic indicators, other factors that can impact the foodservice industry and demand for disposable products include:
  • the mix of restaurants that are limited versus full-service, as limited service restaurants use a higher level and broader mix of disposables
  • the share of total restaurant orders that are provided via drive-thru, curbside pickup, carryout, or delivery services
  • the size and diversity of restaurant menus, as specific disposables are often used with specific menu items
  • social factors such as health concerns, which not only influence the amount consumers eat out but the type of foods they purchase
  • sustainability initiatives, which impact the overall level of disposables used as well as the types of products and materials used
  • regulations, especially restrictions on specific materials or types of disposables

Product Focus


Prior to 2020, foodservice revenues experienced healthy growth in market value in the range of around 3-6% per year, reflecting a combination of rising menu prices, a general shift toward out-of-home dining – particularly among younger people at fast casual restaurants and coffee shops – and the increasing incidence of limited service restaurants bolstering their menus by offering more premium and novelty options.

In 2020, overall foodservice revenues fell sharply, with full-service restaurants experiencing the largest declines due to their smaller focus on drive-thru and carryout services. Revenues for QSRs were impacted less, as demand shifted from in-restaurant dining to drive-thru and curbside pick-up and was further supported by the increased popularity and support of mobile ordering apps.

In response to the pandemic, restaurants in many parts of the country closed their dining rooms and offered takeout and delivery options only. This particularly impacted full-service restaurants, for which takeout or delivery had been a small portion of their business.

To date, restaurant revenues have mostly returned to pre-pandemic levels, although a significant part of recent revenue gains has been due to heightened inflation during 2021 and 2022 and not real volume recovery. The channels through which these revenues come has shifted somewhat, with both limited- and full service restaurants owing a larger portion of their revenue to delivery and takeout orders compared to historical levels.

Study Description

This study examines the US market for foodservice disposable packaging, defined as packaging used by foodservice locations to serve and package food, and meant to be disposed of. Serviceware – such as dinnerware, cutlery, straws, and napkins – is also covered. Historical data are provided for 2012, 2017, and 2022, with forecasts through 2027. Annual data is provided for 2018-2026. Also provided is an analysis of key industry players.

Single-Use Products Overview

Single-use disposable foodservice products is forecast to rise 3.8% per year to $33.2 billion in 2027, with the fastest growth expected for products where sustainability is driving demand toward higher-value formats or where high levels of carryout and delivery activity are changing the product mix. 
Factors driving overall advances include:
  • a return to growth in the number of meals prepared or eaten away from home, after a brief disruption in 2020
  • an expansion of takeout, curbside pickup, and delivery (which require greater use of disposables) facilitated by third-party websites and apps, particularly in restaurants that traditionally only offered dine-in options
  • changing eating habits, including snacking throughout the day and eating on-the-go, which benefit foodservice sales made not only at restaurants but also at retail establishments, especially convenience stores and grocery stores
  • foodservice markets converting to higher value products with either better performance or an improved environmental profile
Purchase Options

Purchase Report

Select your license:

  • $5,900.00
  • $6,500.00
  • $8,500.00
  • — —
    Section prices in Table of Contents

Free Sample Report

A free sample report is available.

Subscription Options

License by subscription

Check to see if this report is available through our subscription services.

Subscription Pricing
Already have a subscription? Log in.

Questions & Assistance

Email us

Share This Report

Copied to clipboard. Could not copy to clipboard.

Download a Free Sample Report Now

Sample Reports include examples of all the tables, charts, infographics and topics included in this study.
We are providing this product sample both to illustrate the nature of our product and to collect contact information for future marketing purposes. If you do not provide your marketing consent we reserve the right not to deliver the product sample.
The Freedonia Group needs the contact information you provide to us to contact you about our products and services. You may unsubscribe from these communications at any time. For information on how to unsubscribe, as well as our privacy practices and commitment to protecting your privacy, please review our Privacy Policy.

Use Licenses

The Single User License (SUL) authorizes a single individual to use the electronic study acquired. Agreement to the SUL is required in order to purchase the study. If you require more than one user a Departmental Site License or Global Site License should be purchased. 

The Departmental Site License (DSL) authorizes up to five users to share the study acquired. Agreement to the DSL is required in order to purchase the study. If your organization requires more than five users, the Global Site License should be purchased.

The Global Site License (GSL) allows everyone in your organization to share the study intelligence. Agreement to the Global Site License terms is necessary in order to purchase it. 

FAQs

For the purposes of this study, “single-use” products refers to items used in the service of food and beverages that are intended to be disposed of after use. Items with increased durability that allow multiple uses for various applications, such as plastic takeout containers, are included.
Demand for foodservice single-use products is driven by foodservice activity, which for the purposes of this report is measured in terms of revenues. Revenues are influenced by the number of orders or meals served in combination with the type of food purchased and the average customer check.
Demand for single-use disposable foodservice products is forecast to rise 3.8% per year to $33.2 billion in 2027, with the fastest growth expected for products where sustainability is driving demand toward higher-value formats or where high levels of carryout and delivery activity are changing the product mix.
Although hundreds of companies are active in the US foodservice single-use products market, the industry is fairly concentrated at the top. The five leading companies are Pactiv, Evergreen, Dart Container, Georgia-Pacific, Graphic Packaging, and Novolex
;

Related Reports and Studies

  • US Cups & Lids

    Industry Reports

    This study examines the US market for disposable cups and lids. Historical data are provided for 2012, 2017, and 2022, with forecasts through 2032. Annual data is provided for 2018-2026.

    February 2024 386 pages
    Free sample available
  • US Retail Bags

    Industry Reports

    This Freedonia industry study analyzes the $4.5 billion US retail bag industry. It presents historical demand data (2012, 2017, and 2019 through 2022) and forecasts (2023 through 2027 and 2032) by type (single-use and reusable), material (plastic, paper, and natural fabric) and market (grocery stores, foodservice, and other retail stores).

    September 2023 272 pages
    Free sample available
  • Global Commercial Refrigeration Equipment

    Industry Reports

    This Freedonia industry analyzes the more than $40 billion global commercial refrigeration equipment market. It presents historical supply and demand data (2013, 2018, and 2023) and forecasts (2028 and 2033), as well as annual data for the 2020-2027 period.

    June 2024 431 pages
    Free sample available
  • US Fresh Produce Packaging

    Industry Reports

    This Freedonia industry study analyzes the $6.1 billion US market for fresh produce packaging. It presents historical demand data (2013, 2018, and 2023) and forecasts (2028 and 2033) as well as annual data for years 2020-2027.

    May 2024 364 pages
    Free sample available
  • US Egg Packaging

    Industry Reports

    This study analyzes the US market for egg packaging. Historical data (2013, 2018, and 2023) and forecasts for 2028 and 2033 are presented for egg packaging demand in units and current US dollars (including inflation) by product, packaging material, egg format, and market. Annual data for 2020 to 2027 are also presented.

    October 2024 213 pages
    Free sample available
  • US Shopping & Dining Consumer Insights 2023

    Industry Reports

    This study examines consumer insights and trends in the US regarding shopping and dining out activity. Survey data capture insights for 2023, and some historical context back to 2020 and earlier.

    July 2023 68 pages
    Free sample available
  • US Manufacturing Wipes

    Industry Reports

    This Freedonia industry study analyzes the $570 million US manufacturing wipes industry. It presents historical demand data (2011, 2016 and 2021) and forecasts (2026 and 2031) by application, and type.

    February 2023 79 pages
    Free sample available
  • US Plastic Foodservice Disposables

    Industry Reports

    This report covers the scope, size, and growth of the US market for plastic foodservice disposable packaging and serviceware, including key trends in material, product, and market segments.

    February 2023 201 pages
    Free sample available
  • US Plastic Packaging for Food

    Industry Reports

    This study examines the US market for plastic food packaging, defined as primary and secondary packaging materials sold to food manufacturers, primarily for products targeted at retail or foodservice markets. Historical data are provided for 2012, 2017, and 2022, with forecasts through 2027 and 2032. Annual data is provided for 2018-2026.

    October 2023 255 pages
    Free sample available
  • US Molded Fiber Food Packaging

    Industry Reports

    This Freedonia industry study analyzes the $532 million US molded fiber food packaging industry. It presents historical demand data (2012, 2017 and 2022) and forecasts (2027) by product (trays and flats, egg cartons, baskets, tills and punnets, and new products) and applications (eggs, fresh produce, prepared foods, meat, poultry, and seafood, and other foods).

    November 2023 130 pages
    Free sample available
View More

Have unique research needs?

Freedonia Custom Research listens intently to your needs and objectives. Then we work diligently to define a service offering to meet them.
Learn About Our Custom Research Services

Stay informed with Freedonia

Receive periodic updates about new market research in areas relevant to your business. Have the convenience of Freedonia research at your fingertips when you need it.
The Freedonia Group needs the contact information you provide to us to contact you about our products and services. You may unsubscribe from these communications at any time. For information on how to unsubscribe, as well as our privacy practices and commitment to protecting your privacy, please review our Privacy Policy.
  • Contact
  • About
  • Help Center
  • Career Opportunities
  • Press Contact
  • User Agreement
  • Privacy Policy
  • Site Map

Additional Resources

  • Market Size Resources
  • Lawn & Garden Market Research
  • Roofing Market Research
  • Pet Products Market Research
  • Countertops Market Research
  • Power Tools Market Research
  • Publishing for the PreK-12 Market Research
  • Insulation Market Resaerch
  • Cabinets Market Research
  • Flooring Market Research
  • Pet Supplements Market Research
  • Agricultural Equipment Market Research
  • Open Access Publishing Market Research
  • Silicones Market Research
  • For Legal Inquiries, contact Cohen & Cohen
Copyright © 2025 The Freedonia Group, Inc. All rights reserved.