Report Overview
This market was heavily impacted by changes in consumer behavior and spending during the pandemic.
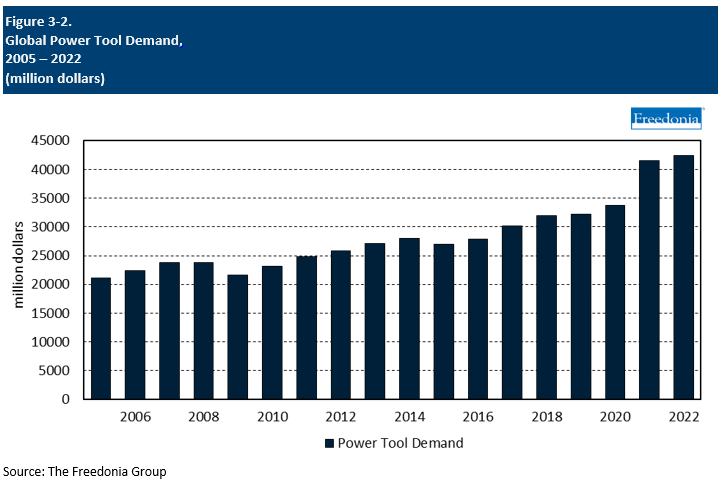
This Freedonia industry study analyzes the $42.4 billion global power tools industry.  It presents historical demand data (2012, 2017, and 2022) and forecasts (2027 and 2032) by product (electric tools, pneumatic tools, tools powered by other energy sources), market (construction, motor vehicle aftermarket, other professional markets, consumer), and region (North America, Central and South America, Western Europe, Eastern Europe, Asia/Pacific, Africa/Mideast). Demand for electric tools is further segmented by product (drills; saws; sanders, polishers, and grinders; other electric tools, parts and attachments for electric tools) and power source (plug-in, cordless). The study discusses the impact of the COVID-19 pandemic. The study also evaluates company market share and competitive analysis on industry competitors including Bosch, Hilti, Makita, Stanley Black & Decker, and Techtronic Industries.
Featuring 298 tables and 132 figures – available in Excel and Powerpoint! Learn More
This report includes data from 2011-2031 in 5 year intervals and tables featuring year-by-year data for 2018-2025.
Global demand for power tools is forecast to increase 2.5% per year to $48.0 billion in 2027, a deceleration from the previous period when a pandemic-influenced surge in sales in 2020 and 2021 drove growth. Gains will be supported by increased construction and durable goods manufacturing activity, particularly in lower-income nations. However, weak prospects for consumer sales will hamper the pace of growth in higher-income nations.
Consumer Markets to Remain Elevated Following Pandemic-Driven Peak
Global sales of power tools in the consumer market increased dramatically in both 2020 and 2021. Growth was driven by the social environment of the pandemic, as increased time spent at home sparked heightened interest in DIY home improvement projects and associated products. As social conditions began to normalize in 2022, interest in DIY activities waned and consumers redirected discretionary spending toward away-from-home activities. As a result, power tool sales in the consumer market declined in many countries. This trend is expected to continue in 2023, with the global consumer power tools market contracting further. However, sales will remain far above 2019 levels, with many new power tool purchasers retaining a longer-term interest in DIY activity.
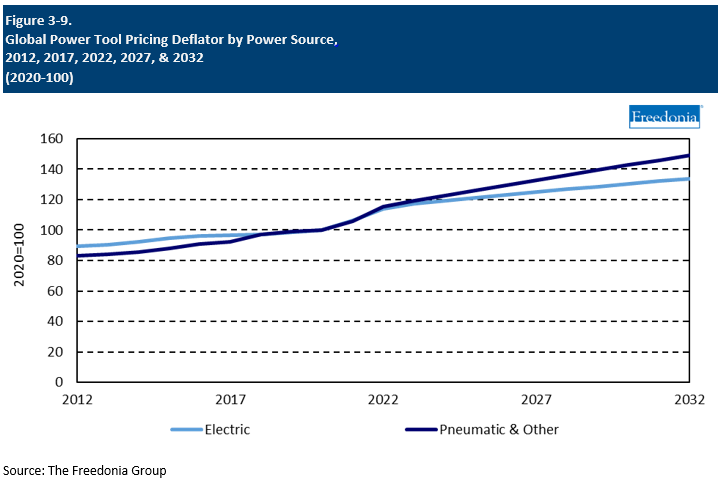
Power Tool Prices Expected to Stabilize but Remain Elevated
Global average power tool prices increased faster than historically typical rates in 2021 and 2022, with particularly large price hikes in the latter year. Price growth was attributable to supply chain issues associated with the COVID-19 pandemic, which created an inflationary environment in a wide variety of global markets. Prices of metals and other raw materials spiked, as did the cost of transporting goods. By the early part of 2023, prices of most raw materials had normalized to an extent, typically falling well below peak levels seen in the preceding two years. As a result, recent elevated rates of price growth are not expected to continue. However, the inflationary environment associated with the pandemic also contributed to increased labor costs, and the stickiness of wages will pose an obstacle to any price reductions. Thus, power tool prices are not expected to fall despite lower material costs.
Cordless Electric Tools Continuing to Gain Ground in Professional Markets
Rising market share for cordless electric tools – and corresponding losses for plug-in electric tools – has been a critical trend in the global power tools industry for some time. By 2022, cordless electric tools had already taken a dominant share of consumer markets in higher-income nations, leaving limited opportunities for further market share gains in these segments. However, these products are rapidly gaining share in professional markets, a trend that is expected to continue for some time.
Increased penetration of professional markets by cordless electric tools is mainly attributable to improving battery technology. Battery-powered tools are increasingly able to output sufficient power to meet the needs of professional users, with increased run times further contributing to greater usability. Continued growth for cordless electric tools will be supported by the development of unified battery platforms, which will allow professional operators to maintain a diverse inventory of tools without having to invest in individual batteries for every tool.
Historical Market Trends
Factors impacting power tool demand include:
- building construction activity
- manufacturing activity
- consumer spending levels
In addition, changes in exchange rates and price levels impact power tool demand as measured in US dollar terms.
Due to the volatility of these indicators – in particular building construction – sales can fluctuate significantly from year to year. However, market volatility at the global level is mitigated to an extent by economic development in industrializing countries, which has provided a steady source of growth throughout recent history.
 Reginal Trends
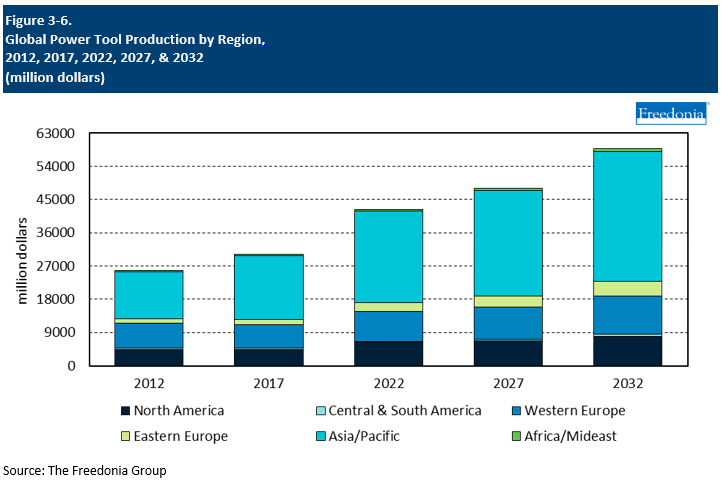
Production by Region
Most of the world’s largest power tool manufacturers are headquartered in high-income nations, reflecting the historical concentration of demand in these established markets. However, China is by far the largest supplier of these products worldwide, accounting for 44% of global output in 2022.
To a large extent, growth in Chinese production has been driven by offshoring efforts by multinational firms seeking to take advantage of the country’s lower labor costs:
- A large share of the power tools produced in China are made by foreign firms, and many domestic manufacturers do not have their own brands, instead acting as OEMs or original design manufacturers (ODMs) serving outside suppliers.
- In spite of the country’s rapidly growing domestic market, there are few Chinese power tool manufacturers that are large by global standards.
Through 2027, global production of power tools is forecast to increase 2.5% per year to $48.0 billion. The Asia/Pacific region will account for the largest share of gains, fueled by continued expansion of the Chinese market and rapid market development in industrializing nations. China will also continue to take a significant share of sales growth in export markets outside the region. While China’s advantage as a producer with low production costs has become less significant as the economy has developed and income levels have risen, its existing power tool industry and supporting infrastructure mean that it will continue to be a leading global exporter.
The US, Germany, and Japan all remain important centers of power tool production, but output in these countries was still collectively less than that in China in 2022. Going forward, gains in domestic output in these countries will be restrained by a slower growth outlook in local markets and continued competition from suppliers in nations with lower production costs.
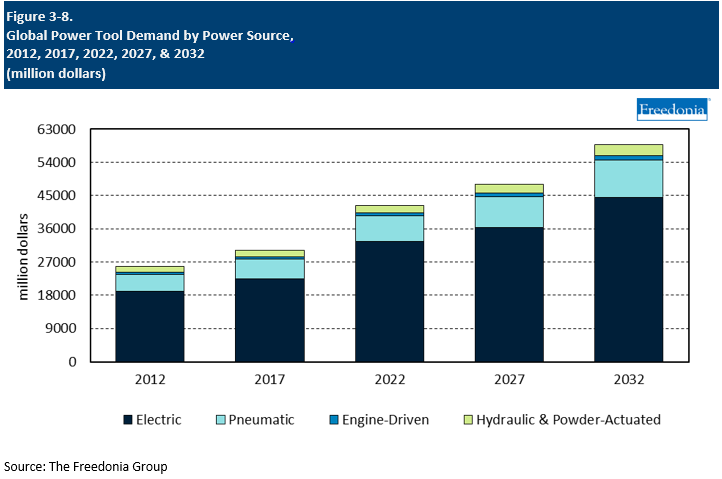
Power Source Trends
Global power tool sales are forecast to rise 2.5% per year to $48.0 billion in 2027. Electric tools will continue to comprise the largest share of the global power tools market, accounting for 67% of sales gains between 2022 and 2027:
- Sales of these products will be sustained by their suitability for both professional and consumer applications.
- Cordless electric tools will post particularly strong gains as performance advances make these increasingly competitive in professional markets.
The outlook for pneumatic tools will be restrained to an extent by increased competition from cordless electric tools. However, pneumatic tools will remain widely used in environments where a cord is not a major constraint, such as in motor vehicle repair shops. Improvements in battery technology will also have some positive impacts on the usability of pneumatic tools, as companies are increasingly offer cordless compressors that improve the convenience of pneumatic tools for applications like roofing.
Sales of other power tools – such as hydraulic and powder-actuated types – will be boosted primarily by expanding professional markets. These products typically feature strong performance in terms of power, a trait that will limit the impact of battery-powered competition in the near term. However, efforts to improve the environmental friendliness of power tool product lines will pose challenges for sales of engine-driven products.
Pricing Patterns
Given the intense degree of competition among producers, pricing is a critical determinant of power tool demand; in developing countries, it is often the primary purchasing criterion. A number of factors determine prices of power tools within a country, including:
-
trends in local inflation
-
intensity of local demand
-
local availability of supplies
-
relative sizes of power tool markets (e.g., consumer versus professional)
Factors such as significant international trade activity and the extensive international production and marketing operations of the major suppliers work to push average power tool prices (adjusted for relative currency fluctuations) near a global average for any given product type and level of quality. There remains, nonetheless, variation on a country-by-country basis.
Prices of power tools vary across product types, ranging from a few dollars for accessories such as saw blades to thousands of dollars for high-performance industrial power tools. In general, electric tools, which are the most commonly used type of tool in the consumer market, are less expensive than pneumatic and other types.
Pricing also varies within product categories. For example, electric drills range from less than $30 for lower-end consumer models to more than $300 for professional cordless drills with advanced features.
Prices for power tools rose at a fast rate in 2021 and 2022, making these one of many products impacted by an inflationary environment associated with the COVID-19 pandemic. Increased prices were mainly attributable to supply chain issues, which contributed to high prices of both raw materials and transporting goods. An unexpected surge in demand among consumers also contributed to high prices.