Report Overview
 Get more about how India, the second largest new housing market in the world, will see above average growth as the rapidly expanding middle class acquires new homes. Read more...
This Freedonia industry study analyzes the global housing industry, with construction of new housing units expected to grow 2.1% annually to 62.0 million units in 2028. The study presents historical demand data (2013, 2018, and 2023) and forecasts (2028 and 2033) for housing stock and new housing unit construction by type (single-family, multifamily).
Featuring 169 tables and 244 figures – available in Excel and Powerpoint! Learn More
Global construction of new housing is forecast to advance 2.1% per year through 2028 to 62.0 million units. Increases will be supported by:
-
expanding urbanization in the Africa/Mideast region, boosting demand for multifamily housing in urban locations
-
above average growth in India – the second largest new housing market in the world – where the middle class is experiencing robust expansion and becoming more able to acquire new homes
-
continuing efforts to boost the supply of social housing to reduce the population living in inadequate, informal homes
However, new housing construction will be constrained by:
-
a decline in new housing units in the US due to high mortgage rates and construction material costs, construction labor shortages, and relatively slow population growth
-
negligible increases in China – the world’s largest housing market – stemming from a slight decline in population and continued liquidity issues among large building developers in the short term
In 2023, countries worldwide contended with high levels of inflation and construction costs (and in some countries, high mortgage rates), which led to a slight decline in new housing activity from 2022 levels. Although such conditions are expected to moderate in many countries, housing affordability will remain a major hurdle in new housing construction.
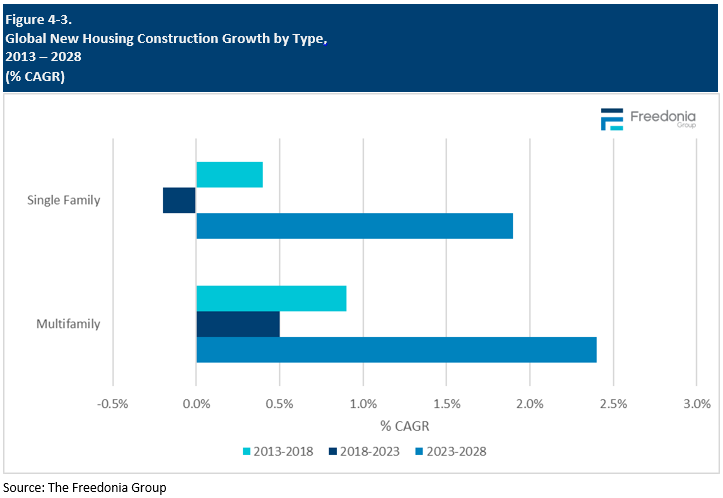
New Multifamily Housing is Forecast to Outpace Single-Family Housing
Multifamily housing construction is expected to outpace single-family housing due to its greater affordability, particularly for those in crowded urban areas who need access to public transportation. In addition, longer term trends continue to bolster demand for multifamily units, including:
-
ongoing rural-to-urban migration in developing nations such as India, Brazil, and Nigeria
-
government initiatives aimed at reducing the number of people living in inadequate housing
- high interest rates and home prices that make single-family homes unaffordable in countries such as the US, where potential buyers typically rely on financing to back their purchases
Housing Stock
Types of Housing (Single-Family & Multifamily)
The global housing stock is segmented into single-family and multifamily types:
-
Single-family housing consists of detached, freestanding housing units, typically built on lots larger than the individual structure (including site-built and manufactured dwellings).
-
Multifamily housing units are contained in a building or complex along with other multifamily units (e.g., apartments, condominiums, townhouses).
Single-family dwellings accounted for 62% of the global housing stock in 2023 and are the most prevalent type of housing in rural areas. As such, areas in which a larger share of the population is rural – such as many parts of the Asia/Pacific and Africa/Mideast regions – see high proportions of single-family housing. For example, in Vietnam, single-family homes comprise 96% of the housing stock because of the country’s large proportion of rural, self-built homes.
Industrialized countries with low population densities per square kilometer (e.g., Australia, Canada, and the US) also tend to have larger shares of single-family dwellings, as lower population densities generally make land less expensive and more readily available, even in urban areas.
Residential Floor Space (Dwelling Size)
The average size of a home can vary widely by region due to several factors, including:
The US had the largest average dwelling size in 2023 at 160 square meters per unit largely because of the domination of single-family houses, which are popular because of the country’s widespread availability of land and an effective road and highway system that enables people to live outside of city centers while still being able to efficiently travel to workplaces. In addition, the US’ high level of affluence and easy access to mortgage financing has made single-family homes more popular than smaller, less expensive multifamily alternatives. In recent years, however, as construction costs and high mortgage rates have made homes more expensive, demand for smaller – and thus more economical – houses have increased.
Eastern Europe had the smallest average dwelling size in 2023, stemming from the region’s smaller average income levels, which make larger single-family homes less affordable. As a result, more modestly sized multifamily housing such as apartments dominates this region.
Although single-family housing dominates the Africa/Mideast region, the average dwelling size was only 69.3 square meters in 2023, stemming from the region’s high levels of poverty – which makes owning larger homes more difficult – and large rural populations that occupy small single-family dwellings.
Housing Characteristics
There can be significant variation in trends such as the number of dwellings per household, homeownership levels, and average dwelling size, even among countries in the same region.
The general quality of a country’s housing stock varies according to factors such as:
Housing units of higher quality tend to be larger, have amenities including indoor kitchen and bathroom facilities, and are structurally sound.
Homeownership
Homeownership rates vary widely and are determined by a range of factors, including:
-
the size and health of the private rental sector
-
a country’s supply of subsidized, social housing
-
home prices, which affect affordability, and access to credit
-
unique historical trends and cultural preferences – such as the privatization of housing in Eastern Europe during the post-Soviet era, when tenants were offered favorable purchase options that drove up homeownership levels
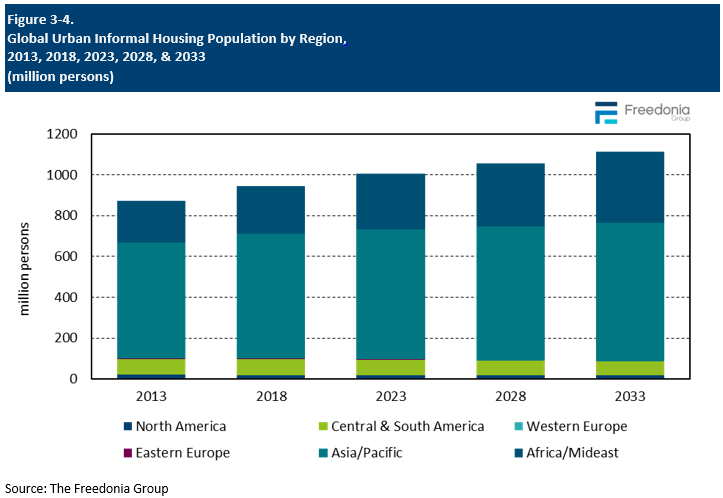
Informal Housing
Data totals for new and existing dwellings include informal housing settlements, which consist of groups of dwellings that have been built on land to which the occupants have no legal claim and that do not comply with city planning or other building regulations.
In 2023, 1.0 billion urban residents – equivalent to 22% of the world’s urban population – lived in informal housing units. Despite generally higher incomes in urban areas, the quality of urban housing can vary widely:
-
In developing countries, economic opportunities in urban settings have encouraged migration from rural to urban areas – a process that has generated demand for new housing.
-
A lack of land tenure laws and other property rights has contributed to the use of informal housing, or urban slum dwellings, to satisfy that housing demand, especially in countries with large low-income urban populations.
-
Most high-income countries, on the other hand, have very small portions of their population living in slums or other improvised housing.
In 2023, the largest urban slum population was in the Asia/Pacific region, which accounted for 64% of the global total. India had by far the largest urban population living in informal housing, which can be attributed to the country’s large overall population and rapidly expanding urbanization rates. However, government attempts to improve living conditions may help to further reduce the proportion of urban residents living in informal housing in the country.
In the Africa/Mideast region – which accounted for 27% of the global urban slum population in 2023 – the prevalence of informal housing is higher than in any other region. In sub-Saharan Africa, for instance, 51% of urban residents lived in improvised housing in 2023. The Africa/Mideast region is forecast to see its urban slum population increase at the fastest pace of all regions, as the commercial construction of affordable housing units fails to keep pace with demand in rapidly expanding urban areas.
New Housing by Type
Growth in the construction of multifamily units is expected to outpace that of single-family units, rising 2.4% per year through 2028 to account for 44% of all new homes constructed. The market for multifamily housing will continue to be driven by:
-
increased urbanization, particularly in developing countries
-
high home prices and limited financing, preventing many households from purchasing a new single-family home
-
government investment in subsidized, social housing units for low-income households
-
a growing affordable rental market
An increase in single-family housing construction will stem from rising per capita incomes, which will generate new opportunities for larger, detached dwellings in many areas. In addition, demand will continue to be high in countries with significant existing rural populations such as Vietnam, where living standards are improving.
However, new single-family homes will continue to be unaffordable for large portions of the population, particularly in developing urban areas where housing shortages are common.