Report Overview
Competitive intelligence is important to know for this market.
-
Some may not be aware of new trends or developments
-
Market segments or products that are becoming more popular
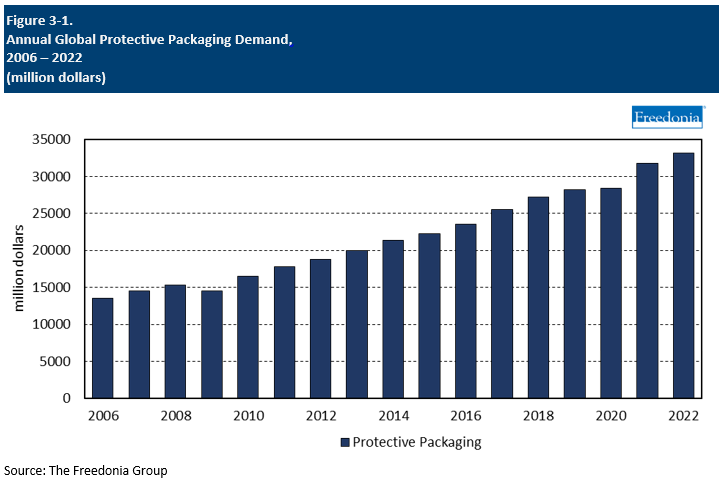
This Freedonia industry study analyzes the $33.2 billion global protective packaging industry.
It presents historical demand data (2012, 2017, and 2022) and forecasts (2027 and 2022) by product (flexible protective packaging, foam protective packaging, rigid protective packaging), market (durable goods, nondurable goods, e-commerce, retail and other markets), and region (North America, Central and South America, Western Europe, Eastern Europe, Asia/Pacific, Africa/Mideast). The study also evaluates company market share and competitive analysis on industry competitors including Abriso Jiffy, Cascades, Crown Holdings, DS Smith, Mondi, Packaging Corporation of America, and WestRock.
Featuring 235 tables and 154 figures – available in Excel and Powerpoint! Learn More
This report includes data from 2011-2031 in 5 year intervals and tables featuring year-by-year data for 2018-2025.
Global demand for protective packaging is forecast to increase 4.0% annually to $40.4 billion in 2027. Gains will be driven by double-digit growth in e-commerce sales, in addition to rising production of durable goods and protective packaging-intensive nondurable goods, such as chemicals and pharmaceuticals and food and beverages.
E-Commerce Drives Use of Flexible Protective Packaging
E-commerce has been the fastest growing market for protective packaging over the past decade as online purchases have continued to make up a larger share of retail sales, most notably in such countries as the US and China. In addition, e-commerce is rapidly rising in lower income countries as internet access and smartphone penetration grows.
Among the major product types, flexible protective packaging will continue to benefit the most from e-commerce’s expansion:
- A focus on right-sizing and source reduction by online retailers will drive demand for protective mailers.
- The widespread use of corrugated boxes for e-commerce shipping will support demand for protective packaging that is often used in conjunction with boxes, such as bubble wrap, air pillows, and paper fill.
Sustainability Will Impact the Protective Packaging Market Going Forward
Although sustainability concerns – such as the use of non-recyclable plastics and the carbon footprint of packaging production – have a larger impact on primary packaging, the protective packaging market will also see sustainability trends that will impact future growth and product mix. These effects will have a relatively larger impact on foam protective packaging. For example, government regulations limiting or banning the use of certain plastics and manufacturer pledges to reduce plastic use have prompted protective packaging suppliers to offer more sustainable products, such as paper-based fill and insulating products or starch-based foam products as replacements for expanded polystyrene.
Although plastic protective packaging (especially foam protective packaging) will continue to be the focus of environmental concern, plastic will continue to be used for protective packaging due to its advantageous properties, including crush resistance and moisture resistance, which can reduce losses due to leaking during transportation.
Historical Market Trends
The market for protective packaging products is primarily influenced by trends in manufacturing output and e-commerce sales.
Between 2010 and 2020, protective packaging demand grew faster than manufacturing output due to:
- increased awareness of protective packaging’s ability to reduce the rate of returns of damaged goods
- the ongoing shift to value-added protective materials with superior performance
The main driver of the protective packaging market in recent years has been the rapidly rising penetration of e-commerce into retail sales. The rise of e-commerce has increased the number of packages requiring protection; in contrast, products sold through traditional retail channels are shipped in bulk rather than in individual parcels.
However, in 2020 demand for protective packaging stagnated, growing less than 1.0%. Manufacturing activity slowed significantly that year due to the impact of the COVID-19 pandemic. The closure of “nonessential” manufacturing, scarcity of raw materials, and a slowdown in shipping and transportation due to a dearth of workers all acted to restrain manufacturing activity worldwide. Greater losses were prevented by the ubiquity of protective packaging and strong increases in e-commerce shopping.
Demand rebounded sharply in 2021 before moderating in 2022. Although increases in 2021 and 2022 were due in part to an increase in the amount of protective packaging uses worldwide, price increases also played a role. Raw material shortages and transportation issues had a lingering impact on prices that lasted beyond the initial months of the COVID-19 pandemic into 2022.
Protective Packaging Product Overview
Global protective packaging demand is projected to advance 4.0% per year through 2027 to $40.4 billion. Gains across all product categories will be driven by rising use of protective packaging in manufacturing, e-commerce, and retail applications, particularly in low- and middle-income countries.
Flexible protective packaging will see the fastest gains of the three major product categories, with growth driven by:
-
the predominance of flexible packaging types in the e-commerce market, which is expanding at a faster pace than other major markets
-
increasing use of paper fill in manufacturing applications due to its low cost and recyclability
-
logistical advantages such as reduced shipping and storage costs, as bubble packaging and air pillows can be manufactured at the customer’s location
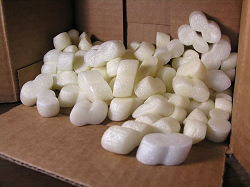
However, foam and rigid products retain some advantages over flexible product types, particularly in manufacturing applications. Foam protective packaging provides better temperature stability and better protects sensitive components that cannot be jostled without being damaged, while rigid types are easily recyclable. 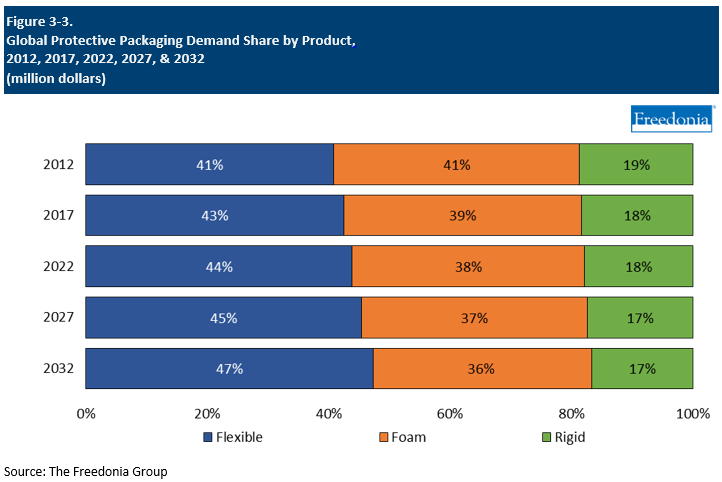
Product Functions
Protective packaging provides a number of overlapping functions, including:
- cushioning
- blocking and bracing
- insulation
- void fill
- wrapping
Materials that can perform more than one of these functions have a marketing advantage in the case of small users who prefer the simplicity of using as few packaging products as possible. However, larger users typically use the product they believe is most suitable for the specific application.
Right-sizing of packaging, particularly in e-commerce, is expected to constrain demand for protective packaging in void fill and bracing functions to a certain extent. However, opportunities remain if protective packaging suppliers emphasize the cushioning, insulation, and wrapping functions of their products. Products such as air pillows, bubble packaging, loose fill, or paper fill may no longer be needed as void fill. However, a supplier can tout their ability to protect delicate items like glass bottles or jewelry from product damage.
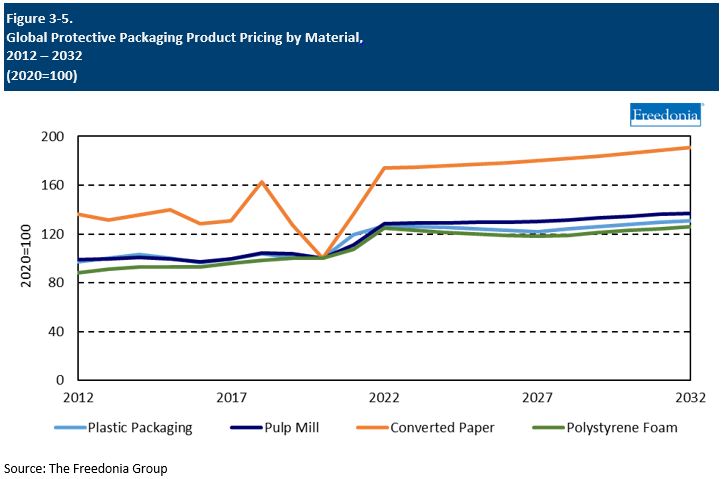
Pricing Patterns
Prices for protective packaging vary widely, given the proliferation of product types, material choices, and product sizes. Prices in the protective packaging industry vary by type, application, material thickness, and volume, among other variables, such as geographic location.
However, pricing is a critical issue for protective packaging suppliers due to the commodity nature of most products. Price is the primary differentiating factor in many product selections because:
-
products such as EPS foam molded components, paper and foam fill products, and paperboard protectors, are often commodity products with limited brand differentiation, and are available from multiple suppliers
-
the ability to substitute materials in many applications limits the effect of price changes brought about by supply and demand imbalances
As a result, price competition in the protective packaging industry tends to be intense, both between different materials and between vendors of comparable or nearly identical products. However, end users must also consider other factors as well, with manufacturers who supply particularly delicate products often opting for more costly product types.
In general, foamed plastic products are among the least expensive. However, some foam products may cost more than competitive products. This is due to:
-
high raw material prices and the high degree of processing (blowing, molding into the desired shape) required to generate the finished product
-
the use of molded foams, insulated shipping containers, and foam-in-place to protect higher value, fragile, or temperature-sensitive items
Prices for a number of protective packaging products spiked in 2022 due to a combination of high inflation and the continuation of supply chain issues that had affected the industry since 2020. Going forward, prices will essentially stagnate from this elevated base.