

Food Carryout and Delivery: US Market Trends and Opportunities, 3rd Edition
This Packaged Facts report analyses the $727 billion food carryout and delivery market. Food carryout and delivery sales are projected to grow at an average rate of 5.1% annually through 2028.
Free Sample Report
Request a free sample of this report and our team will email it to you.
Report Overview
 Food Carryout and Delivery Is Ideal During a Labor Crunch: Restaurant staffing shortages are impacting the carryout and delivery market.
For consumers, food delivery and carryout are driven by convenience factors, while dine-in restaurant service is more about the restaurant experience and socialization. Delivery will be growing faster than carryout due to starting from a lower base of sales and continuing expansion in foodservice delivery options.
See our blog about the Future of Food Takeout!
Delivery and carryout can also benefit restaurants that are facing labor issues. For instance, a shortage of servers can challenge the restaurant experience by causing long waits for tables and service. Ordering food to pick up or getting food delivered can cut down on a potentially negative customer experience inside a restaurant.
Additionally, when delivery drivers are in short supply, automating delivery via drones, robots, or autonomous vehicles where available can make this option accessible and less expensive to customers who might otherwise wait a long time to receive an order.
With a focus on “what’s next” and current consumer trends, Food Carryout and Delivery: US Market Trends and Opportunities is packed with insights about consumers trends, behavior, and motivations to help food producers, foodservice companies, retailers, packaging firms, employers, and investors gauge consumer perspectives and find areas for growth in a competitive market.
Food Carryout and Delivery: US Market Trends and Opportunities delivers actionable predictions and recommendations designed to guide producers, retailers, and investors in making business decisions by providing data and insights about food carryout and delivery.
Scope
Food Carryout and Delivery: US Market Trends and Opportunities is the go-to source for a complete understanding of food carryout and delivery trends. This report combines Packaged Facts’ extensive monitoring of the food and beverage market with proprietary surveys, and evaluates current trends and future directions for marketing and retailing, along with consumer patterns during the pandemic and inflation era and across the broader food and beverage market.
This Packaged Facts report analyses the $727 billion food carryout and delivery market. Food carryout and delivery sales are projected to grow at an average rate of 5.1% annually through 2028.
Consumer demographics, perceptions, motivations, and behavior are examined as pertaining to food, diet choice, and use of food carryout and delivery options. Overall food and health habits and attitudes are also examined.
Total foodservice revenues are provided in billion dollars from 2018 to 2023, and projected from 2024 through 2028. Foodservice revenues are also segmented by type of establishment (eating and drinking places, which includes full-service restaurants, fast food restaurants, fast casual restaurants, other eating and drinking places; and other foodservice establishments) and by dine-in vs. off-premises dining (dine-in, carryout, and delivery).
This report also provides sales for the food carryout and delivery market in billion dollars from 2018 to 2023 and forecast from 2024 through 2028, segmented by carryout and delivery.
Additionally, the food carryout and delivery market is segmented by retailer category – fast food restaurants, fast casual restaurants, full service restaurants, grocery stores, convenience stores, and other retailers – for 2023; food delivery sales are further segmented by type of delivery (third-party vs. direct).
The carryout and delivery market includes foodservice operations, as well as sales of site-cooked/prepared, ready-to-eat, or ready-to-heat – in the case of refrigerated or frozen prepared foods that have already been cooked – single-serve and family-sized foods and beverages. Items in this report are often sold by retailers in a “grab-and-go” format, although foods and beverages that are made-to-order or packaged by consumers (e.g., pack your own salad at a salad bar) and taken off premises are included. Non-foodservice venues include:
-
convenience stores
-
direct sellers
-
discount grocers
-
farmers’ markets
-
grocery stores
-
home delivery and mail order companies
-
mass merchandisers
-
third-party/off-premises entities preparing or delivering food on behalf of these venues (e.g., ghost kitchens and third-party delivery services such as Instacart or Grubhub)
-
warehouse clubs
All restaurant food ordered for carryout or delivery is included in the foodservice category since it is generally ready-to-eat and consumed on-demand; however, retailers sell a wide variety of prepared fresh and frozen foods, many of which are not made by the store (or a contracted “ghost kitchen”) in question and are thus not included. Store prepared/cooked items in single-serve portions or family portions that are eaten off-premises and are analogous to a restaurant meal are included, such as:
-
items sold at sandwich/salad/soup bars
-
fresh prepared meals sold via direct marketers/mail order companies/delivery companies in single servings or family servings that are ready-to-eat or ready-to-heat, including refrigerated items and items that are flash-frozen for shipment
-
items sold at sushi bars
-
items sold at hot food bars
-
pizza (both whole pies and individual slices)
-
rotisserie and fried chicken (often sold by the piece, as a whole bird, or in family meal containers)
-
single-serve, ready-to-eat items (e.g., small cups of fresh cut fruit packed by the store and wrapped sandwiches)
The reasons for and implications of shifts in consumer perception and behavior are analyzed in the context of future market opportunities.
Additionally, Food Carryout and Delivery: US Market Trends and Opportunities has dozens of tables highlighting numerical survey data on consumer demographics and psychographics as well as numerous marketing photographs. This report goes in-depth on COVID-19 and inflation trends that have affected the food and beverage market.
Report Methodology
The information contained in Food Carryout and Delivery: US Market Trends and Opportunities was developed from primary and secondary research sources. Primary research includes interviews with food and beverage market experts; participation in and attendance at food industry events; and extensive internet canvassing.
Primary research also includes national online consumer polls of U.S. adult consumers (age 18+) conducted on an ongoing basis by Packaged Facts to analyze attitudes of consumers and their relevant food and beverage preferences.
Survey data from MRI-Simmons are used to analyze the demographics and psychographics of consumers.
Supplementing Packaged Facts’ exclusive surveys are analysis of the 2022 and 2023 Food & Health Surveys conducted by the International Food Information Council, which analyze consumer food purchase decisions, diet and lifestyle choices, snacking activity, and perception of health benefits in foods.
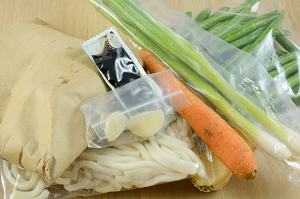
Use of Meal Kit Delivery Services
Corresponding with increased use of online grocery shopping services, some consumers also reported ordering more meal kits for home delivery during the pandemic. However, it is important to note that use of meal kit delivery services does not appear to be as “sticky” of a habit as general online grocery shopping, as the percentages of those reporting they were ordering fewer meal kits has often equaled or exceeded the percentages of those who were ordering more meal kits.
In December 2022, 17% of consumers reported they were ordering more meal kits than they had before the pandemic, while 16% were ordering fewer. Many consumers had changed their cooking habits and use of meal kits during the pandemic and were continuing their behaviors even as the pandemic itself was no longer having much of an impact on people’s decisions.
Meal kit delivery services may compete with prepared meal delivery services and other forms of meals received through carryout and delivery. They can be convenient for those who do not know how to cook but are trying to learn, as meal kits contain step-by-step instructions to prepare a meal. Meal kits can also reduce food waste and/or help someone adhere to a diet since all meals contain pre-portioned ingredients for the recipe at hand.
Though meal kits are more convenient than general grocery shopping since they reduce meal planning time and provide the ingredients, they still require a cooking step that prepared foods ordered for carryout or delivery do not have.
Market leader HelloFresh offers 30+ menu items each week for various interests, including vegetable meals for vegans, vegetarians, and other plant-forward consumers; “fit and wholesome” meals for health-focused people; quick and easy recipes for those who don’t have a lot of time to cook; and family-friendly meals that are “picky eater approved”.
2023 Trends Result from Inflation and Changed Habits
In 2023, holding off on dining out had less to do with the pandemic and more to do with changed habits and high food inflation. Eating out is often one of the first things that consumers cut or reduce when they are economically stressed, so it makes sense that some consumers may not be eating out as much as they did before the pandemic due to self-imposed cuts to keep to budget.
Additionally, some people who were ordering restaurant food for takeout or delivery instead of dining in during the pandemic continued these habits and ate more at home instead of out – no longer because of the coronavirus, but just as a continuation of these eating habits. For instance, some who started ordering a lot of restaurant foods from apps like DoorDash and Grubhub during the pandemic may now be used to this and prefer to eat restaurant foods at home instead of at a restaurant.
- Executive Summary
- Foodservice Outlook
- Technological Advances in Robots, Drones, AI, Apps, and Variable Pricing Will Change the Ordering Ex
- Foodservice Packaging Opportunities: Sustainability and Functionality
- Key Consumer Trends
- Scope
- Food Carryout and Delivery Definition
- Recent Historical Trends from the Pandemic to the Inflation Era
- Highlights
- Boosted Online Grocery Shopping Activity
- Frequency of Grocery Shopping in 2023: In-Person vs. Online
- Use of Meal Kit Delivery Services
- Dining Out
- Consumers Were Still Holding off on Dining Out in 2021 and 2022
- 2023 Trends Result from Inflation and Changed Habits
- Food Carryout and Delivery and Convenience Food Options – Activity in 2021 and 2022
- Snacking and Healthy Eating Habits
- Trends from 2021 to 2022
- Table | Coronavirus Eating Habits: “Because of the coronavirus, I am eating more…”, 2021 (percent of consume
- Changes to Snacking Habits in 2023
- Table | Current Snacking Activity Compared to Pre-Pandemic Levels, 2023 (percent of consumers)
- Trends from 2021 to 2022
- Concerns about COVID-19 Exposure Have Remained
- Historical Trends: Considering the Pandemic a Health Threat Personally or to Family/Friends
- Table | Coronavirus Health Concerns: “I am concerned about…”, 2020 – 2021 (percent of consumers)
- Table | Coronavirus Health Concerns: “I am concerned about…”, 2022 – 2023 (percent of consumers)
- Concerns about COVID-19 Variants
- Concerns about Future Potential Pandemic Outbreaks
- Table | Future Potential Pandemic Outbreak Concerns, 2023 (percent of consumers)
- Vaccination for the Flu and COVID-19
- Table | Consumer Vaccination Plans, 2023 (percent of consumers)
- Table | Consumer Vaccination Rates, 2024 (percent of consumers)
- Some Consumers Are Continuing to Wear Masks in Public and to Avoid Crowds
- Table | Consumer Habits Regarding Masks, Crowds, and Testing for COVID-19, 2024 (percent of consumers)
- Historical Trends: Considering the Pandemic a Health Threat Personally or to Family/Friends
- Negative Personal Effects of the Pandemic
- Mental and Physical Health Effects in 2022
- Reporting Negative Mental States in 2023
- Continuing Mental and Physical Health Effects in 2024
- Table | Current Feelings on Mental and Physical Symptoms Compared to “Normal” or Preferred Level, 2024 (perc
- Stress Levels and Impact on Food/Beverage Consumption
- Effects on Work Habits
- Changes to Work Patterns Continued in 2021 and 2022
- Working from Home in 2023
- Table | Ability to Work from Home and Frequency of Remote Work, 2023 (percent of consumers)
- Table | Working at a Co-Working Space or Working from Home, 2023 (percent of consumers)
- Table | Consumer Rating of Experiences Working at a Co-Working Space or Working from Home, 2023 (percent of
- Table | Consumer Opinions on Working at a Co-Working Space or Working from Home, 2023 (percent of employed c
- Work Habits in 2024
- Table | Where Time Is Spent during a Typical Work Week, 2024 (percent of employed consumers)
- Changes to Travel Habits
- Table | Changes in Work and Leisure Travel Activity, 2024 (percent of consumers)
- Rising Prices: From Supply Chain Crunches to Inflation
- Many Consumers Are Concerned about Inflation and Rising Food Prices
- Table | Consumer Concerns about Rising Food Prices, 2021 – 2024 (percent of consumers)
- The Vast Majority of Consumers Have Noticed the Rising Cost of Food, and Many Are Changing Their Pur
- Consumers Find Price More Important for Food Purchase Decisions in 2023
- Cutting Back on Household Expenses
- Table | Consumers Cutting Back on Household Expenses in the Last 12 Months, 2022 (percent of consumers)
- Table | Types of Household Expenses Cut Back on in the Last 12 Months, 2022 (percent of consumers)
- Table | Consumer Spending on “Extras”, 2023 – 2024 (percent of consumers)
- Many Consumers Are Concerned about Inflation and Rising Food Prices
- Overview & Market Trends
- Highlights
- Convenience the Ultimate Selling Point for Busy Consumers
- US Online Grocery Shopping Well Behind Other Countries, but There Are Opportunities for Prepared Mea
- Contactless Transactions and Digital Pre-Payment Have Landed with Consumers
- Blurring the Lines Between Restaurant, Grocery, and Meal Kit Purchases
- Prospects for Restaurants Offering Meal Kits and Take-and-Make/Heat-and-Eat Meals
- Third-Party Delivery Companies Delivering Grocery and Restaurant Items
- Family Meal Portions as the Focus of Carryout and Delivery Options
- Breakfast vs. Lunch vs. Dinner vs. Non-Peak Hours
- Orders at Peak Dining Hours Can Be Supplemented by Third- Parties or “Ghost Kitchens”
- Using Dine-In Experiences to Boost Takeout Sales
- Labor and Supply Shortages and Rising Costs Have Accelerated Testing of Automated Delivery and Robot
- Convenience Used to Mean Unhealthy Foods, but Restaurant Foods Are Getting Healthier (at Least by Pe
- Snacking Trends
- Most Consumers Snack Daily
- Preferred Types of Snacks
- Table | Preferred Types of Snacks, 2023 (percent of consumers)
- “Snackification” of Meals
- When Consumers Snack Throughout the Day
- What Consumers Snack on in the Morning and the Evening/Late Night
- Direct Sellers and Home Delivery Companies
- DTC Companies Tackling Niche Health Food Markets with Prepared Meals
- Table | Selected Meal Delivery Services by Date Founded, Services Offered, and Geographic Area Served
- Convenient Meal Delivery Services Emphasizing Freshness and Healthy Foods
- Targeting Specialized Demographics
- Local and Regional Meal Delivery Companies Often Emphasize Local Ingredients and Compete with Nation
- Customized Meal Delivery Catering to Special Diets and Weight Loss Plans
- DTC Companies Tackling Niche Health Food Markets with Prepared Meals
- Opportunity: Expansion of Carryout and Delivery Options for Children and Families
- Opportunity: Expedited Avenues for Ordering Prepared Meals from Grocery and Convenience Stores
- Opportunity: Meal Delivery and Carryout From Restaurants and Retail Stores Can Expand Food Options f
- Opportunity: Multi-Channel Sales and Expanding Options for Ultimate Convenience
- Opportunity: Autonomous Delivery Can Save Restaurants and Retailers Money
- Drone Delivery
- Robot Delivery
- Autonomous Vehicle (AV) Delivery
- Opportunity: Variable/Dynamic Pricing for Higher Revenue
- Opportunity: Artificial Intelligence for Drive-Thrus and More
- Opportunity: “Ghost Kitchens” or “Dark Kitchens” to Meet Capacity Challenges
- Market Size & Forecast
- Highlights
- Total Foodservice Revenues by Type of Establishment
- Scope
- Historical Trends
- Table | Foodservice Revenues by Type of Establishment, 2018-2023 (billion dollars)
- Forecast
- Table | Foodservice Revenues by Type of Establishment, 2023, 2024P-2028P (billion dollars)
- Foodservice Revenues by Dine-In vs. Off-Premises Dining
- Scope
- Historical Trends
- Table | Foodservice Revenues by Dine-in, Carryout, and Delivery, 2018-2023 (billion dollars)
- Forecast
- Table | Foodservice Revenues by Dine-in, Carryout, and Delivery, 2023, 2024P-2028P (billion dollars)
- Food Carryout and Delivery Market
- Scope
- Historical Trends
- Table | Food Carryout & Delivery Historical Market, 2018-2023 (billion dollars)
- Forecast
- Table | Food Carryout & Delivery Forecast, 2023, 2024P-2028P (billion dollars)
- Food Carryout and Delivery Market by Retailer Category
- Third-Party Delivery Sales
- Purchase Methods
- Highlights
- In-Person Purchases for Carryout
- Restaurant Orders
- Grocery/Retailer Orders
- Third-Party Ordering vs. In-House Ordering
- In-House Purchases for Takeout or Delivery
- Third-Party Restaurant Purchases for Takeout or Delivery
- Third-Party Retailer Ordering
- Online & Mobile Ordering
- Restaurant Ordering
- Grocery Ordering
- Phone Ordering Remains Important For Small, Independent Restaurants & Older Consumers
- Consumer Use Trends
- Highlights
- Use of Food Carryout and Delivery Methods in the Last 12 Months
- Table | Consumer Use of Food Ordering Methods in the Last 12 Months, 2024 (percent of consumers)
- Frequency of Food Carryout and Delivery Habits in the Last 3 Months
- Table | Consumer Frequency of Food Ordering Methods in the Last 3 Months, 2024 (percent of consumers who hav
- Frequency of Food Carryout and Delivery Habits Now Compared to 12 Months Ago
- Table | Consumer Frequency of Food Ordering Habits Now Compared to 12 Months Ago, 2024 (percent of consumers
- Expected Changes to Food Carryout and Delivery Habits in the Next 12 Months
- Table | Consumer Expected Changes to the Frequency of Food Ordering Habits in the Next 12 Months, 2024 (perc
- Reasons for Ordering Carryout/Delivery Meals
- Restaurant Delivery
- Table | Reasons Consumers Have Purchased Restaurant Foods for Delivery, 2024 (percent of consumers using res
- Restaurant Carryout
- Table | Reasons Consumers Have Purchased Restaurant Foods for Carryout, 2024 (percent of consumers using res
- Prepared Meals from Retailer
- Table | Reasons Consumers Have Purchased Prepared Meals from a Retailer for Carryout or Delivery, 2024 (perc
- Meal Delivery Services
- Table | Reasons Consumers Have Used Meal Delivery Services, 2024 (percent of consumers using meal delivery s
- Restaurant Delivery
- Use of Restaurants by Type of Meal, Time of Week, and Services
- Table | Use of Family Restaurants and Steak Houses in the Last 6 Months by Type of Meal, Time of Week, and S
- Table | Use of Fast Food and Drive-In Restaurants in the Last 6 Months by Type of Meal, Time of Week, and Se
- Table | Use of Restaurants in the Last 6 Months by Type of Establishment, 2018-2023 (percent of consumers)
- Frequency of Visits to Restaurants
- Family Restaurants and Steak Houses
- Table | Family Restaurants and Steak Houses – Number of Times Used in the Last 30 Days, 2023 (percent of con
- Fast Food and Drive-In Restaurants
- Table | Fast Food and Drive-In Restaurants – Number of Times Used in the Last 30 Days, 2023 (percent of cons
- Fine Dining Restaurants
- Table | Fine Dining Restaurants – Number of Times Used in the Last 30 Days, 2018-2023 (percent of consumers
- Other Restaurants
- Table | Other Restaurants – Number of Times Used in the Last 30 Days, 2018-2023 (percent of consumers)
- Family Restaurants and Steak Houses
- Expenditures on Restaurants, Convenience Stores, and Food Stores
- Family Restaurants and Steak Houses
- Table | Family Restaurants and Steak Houses – Expenditures in the Last 30 Days, 2018-2023 (percent of consum
- Fast Food and Drive-In Restaurants
- Table | Fast Food and Drive-In Restaurants – Expenditures in the Last 30 Days, 2018-2023 (percent of consume
- Fine Dining Restaurants
- Table | Fine Dining Restaurants – Expenditures in the Last 30 Days, 2018-2023 (percent of consumers)
- Other Restaurants
- Table | Other Restaurants – Expenditures in the Last 30 Days, 2018-2023 (percent of consumers)
- Convenience Stores
- Table | Convenience Stores – Expenditures in the Last 30 Days, 2018-2023 (percent of consumers)
- Food Stores, Grocery Stores, and Warehouse/Club Stores
- Table | Food Stores – Expenditures in an Average Week, 2018-2023 (percent of consumers)
- Family Restaurants and Steak Houses
- Use of Restaurant Delivery Websites or Apps
- Table | Use of Restaurant Delivery Websites or Apps, 2021-2023 (percent of consumers)
- Food Carryout & Delivery Market Participants
- Highlights
- Third-Party Carryout/Delivery Services
- Table | Selected Third-Party Delivery Services and Years Founded
- DoorDash
- Grubhub
- Uber Eats
- Aggregator, Reservation, and Review Sites
- FoodBoss
- OpenTable
- Tripadvisor
- Yelp
- Quick Service Restaurants (QSRs)
- Domino’s Pizza
- Starbucks
- McDonald’s
- Fast Casual Restaurants
- Panera Bread
- Chipotle Mexican Grill
- Full-Service Restaurants
- Darden Restaurants (Olive Garden and LongHorn Steakhouse)
- Dine Brands Global (Applebee’s and IHOP)
- Bloomin’ Brands (Bonefish Grill, Carrabba’s Italian Grill, and Outback Steakhouse)
- Retail Stores (Grocery Stores, Supermarkets, Mass Marketers, Warehouse Clubs, Convenience Stores, et
- Kroger
- Walmart
- Costco
- 7-Eleven
- Direct Marketers and Other Meal Providers (Co-ops, Farmers Markets, Delivery Companies, etc.)
- Factor 75
- Daily Harvest
- Fresh N Lean
- Sakara Life
- Packaging Trends
- Highlights
- Types of Packaging Used in Foodservice and Carryout and Delivery
- Quick Service Restaurants
- Fast Casual Restaurants
- Full-Service Restaurants
- Other Foodservice Venues (Institutional Eating and Drinking Establishments, Lodging and Hospitality,
- Retail Stores (Grocery and Convenience Stores, Warehouse Clubs, Mass Retailers, etc.)
- Other Retailers (Co-Ops and Farmers’ Markets, Direct Marketers and Mail Order/Delivery Companies, et
- Sustainability Issues
- Bring Your Own Container/Reusable Packaging
- Tamper Evident Packaging for Safety and Peace of Mind
- Supply Chain Disruptions and Increasing Foodservice Packaging Prices during the Pandemic
- Consumer Insights on Packaging and Sustainability
- Environmental Attitudes
- Table | Consumer Opinions on Recycling, Packaging, and the Environment, 2023 (percent)
- Thoughts about Sustainability
- Table | Consumer Opinions on Sustainability, 2024 (percent of consumers)
- Importance of Sustainable Lifestyle Practices
- Table | Consumer Opinions on the Importance of Sustainable Lifestyle Practices, 2024 (percent of consumers)
- Use of Disposable Serviceware at Home
- Table | Frequency of Consumer Use of Disposable Serviceware at Home, 2024 (percent of consumers)
- Bring Your Own Container Programs at Restaurants and Coffee Shops
- Table | Consumer Level of Interest in Bring Your Own Container and Returnable Container Programs at Restaura
- Table | Consumer Level of Participation in Bring Your Own Container and Returnable Container Programs at Res
- Opinions on Packaging and Food Waste
- Table | Consumer Opinions on Packaging Appearance, Ease of Use, and QR Code Information, 2024 (percent of co
- Table | Consumer Opinions on Food Packaging, Food Waste, Food Preservation, and More, 2024 (percent of consu
- Environmental Attitudes
- Consumer Demographics
- Highlights
- Trends in Restaurant Takeout/Delivery and Use of Store-Made, Pre-Cooked Meals by Gender
- Table | Use of Store-Made, Pre-Cooked Meals and Restaurant Delivery/Takeout Services by Gender, 2023 (percen
- Table | Use of Food Carryout and Delivery Services in the Last 12 Months by Gender, 2024 (percent of consume
- Younger Consumers Are More Likely to Eat Store-Made, Pre- Cooked Meals and to Use Restaurant Deliver
- Table | Use of Store-Made, Pre-Cooked Meals and Restaurant Delivery/Takeout Services by Age Bracket, 2023 (p
- Table | Use of Food Carryout and Delivery Services in the Last 12 Months by Age Bracket, 2024 (percent of co
- Lower Income Consumers More Often Eat Pre-Cooked Meals from a Store, but Higher Income Groups Can Mo
- Table | Use of Store-Made, Pre-Cooked Meals and Restaurant Delivery/Takeout Services by Household Income Bra
- Table | Use of Food Carryout and Delivery Services in the Last 12 Months by Household Income Bracket, 2024 (
- Store-Made, Pre-Cooked Meals and Restaurant Delivery Are More Likely to be Used by Non-White Consume
- Table | Use of Store-Made, Pre-Cooked Meals and Restaurant Delivery/Takeout Services by Race/Ethnicity,2023
- Table | Use of Food Carryout and Delivery Services in the Last 12 Months by Race/Ethnicity, 2024 (percent of
- Consumers with Children Have More Reasons to Select Convenient Food Options
- Table | Use of Store-Made, Pre-Cooked Meals and Restaurant Delivery/Takeout Services by Parenthood/Presence
- Table | Use of Food Carryout and Delivery Services in the Last 12 Months by Parenthood, 2024 (percent of con
- Use of Pre-Cooked Meals and Restaurant Delivery Higher Among Consumers with Less Education and Curre
- Table | Use of Store-Made, Pre-Cooked Meals and Restaurant Delivery/Takeout Services by Educational Attainme
- Table | Use of Food Carryout and Delivery Services in the Last 12 Months by Educational Attainment, 2024 (pe
- Trends in Restaurant Takeout/Delivery and Use of Store-Made, Pre-Cooked Meals by US Region
- Table | Use of Store-Made, Pre-Cooked Meals and Restaurant Delivery/Takeout Services by US Region, 2023 (per
- Table | Use of Food Carryout and Delivery Services in the Last 12 Months by US Region, 2024 (percent of cons
- Urbanization Trends Reveal Consumers Living in Densely Populated Areas Are Most Likely to Use Restau
- Table | Use of Store-Made, Pre-Cooked Meals and Restaurant Delivery/Takeout Services by County Size, 2023 (p
- Table | Use of Food Carryout and Delivery Services in the Last 12 Months by Urban, Suburban, and Rural Livin
- Consumer Psychographics
- Highlights
- Priorities Placed on Food Characteristics
- Table | Priorities Placed on Foods, 2024 (percent of consumers)
- Snacking Habits
- Table | Statements about Snacking, 2024 (percent of consumers who agree)
- Table | Frequency of Snacking on Typical Weekdays and Weekends, 2023-2024 (percent of consumers who agree)
- Women Have More Concerns About Food and Health and Tend to Cook More, Making Prepared Meals a Harder
- Table | Consumer Opinions on Health, Food, and Nutrition by Gender, 2023 (percent of consumers who agree com
- Older Consumers Are Most Involved with Their Health and Have More Time to Prepare Food
- Table | Consumer Opinions on Health, Food, and Nutrition by Age Bracket, 2023 (percent of consumers who agre
- Non-White Consumers Generally Have More Health and Food- Related Concerns
- Table | Consumer Opinions on Health, Food, and Nutrition by Race/Ethnicity, 2023 (percent of consumers who a
- Parents and Consumers with Children in the Household
- Table | Consumer Opinions on Health, Food, and Nutrition by Parenthood/Presence of Children in HH, 2023 (per
The market size for food carryout and delivery is $727 billion.
Food carryout and delivery sales are anticipated to rise 5.1% annually to reach $932 billion in 2028
In 2023, fast food and fast casual restaurants were the largest contributors to foodservice revenues, with a combined $503 billion in sales.