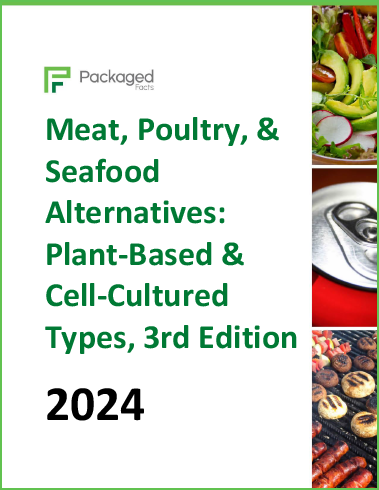
Meat, Poultry, & Seafood Alternatives: Plant-Based and Cell-Cultured Types, 3rd Edition
This report is the go-to source for a complete understanding of U.S. consumer trends regarding plant-based meat products and the future market for cell-cultured (or cultivated, lab-grown) meat.
Free Sample Report
Request a free sample of this report and our team will email it to you.
Report Overview
Plant-Based Meat: A Market in Flux
- The plant-based meat market, once a booming sector, has faced challenges in recent years.
This report examines the $1.4 billion US plant-based meat alternatives market, which is forecast to grow at an average annual rate of 2.4% through 2029. This Packaged Facts report also analyses the dynamics of the current landscape for cell-cultured meat alternatives.
 Meat, Poultry, & Seafood Alternatives: Plant-Based and Cell-Cultured Types is the go-to source for a complete understanding of U.S. consumer trends regarding plant-based meat products and the future market for cell-cultured (or cultivated, lab-grown) meat. This report combines Packaged Facts’ extensive monitoring of the food and beverage market with proprietary surveys, and evaluates current trends and future directions for marketing and retailing, along with consumer patterns during the pandemic, during the inflation area, and across the broader food and beverage market.
This Packaged Facts report analyzes the dynamics of the current landscape of the plant-based meat market as well as plant-forward diets and eating philosophies. Consumers who eat plant-based meat, poultry, or seafood products and those who are open to trying cultivated meat products are examined. Trends including consumer usage of plant-based alternative products, reasons for diet and lifestyle choices, retail and restaurant trends, and the COVID-19 pandemic’s effects on consumers are also investigated.
Historical market size for the retail plant-based meat alternatives market is provided from 2018 through 2023. Forecasts for the plant-based meat market are provided from 2024 to 2029 and 2034. Numbers for the plant-based meat market include breakouts by meat type (beef, chicken, pork, seafood, turkey, fruit and vegetable non-analogs, non-specified meats, and other meat types), meat form, and storage method (refrigerated, frozen, or shelf-stable).
This report also provides foodservice market estimates for plant-based meat alternatives by meat type from 2018 to 2023 and forecasts from 2024 to 2029 and 2034.
Additionally, this report examines the uncertain landscape for cell-cultured (or cultivated, lab-grown) meat products.
The reasons for and implications of shifts in consumer perception and behavior are analyzed in the context of future market opportunities.
Major competitors in the plant-based meat alternatives space, funding for plant-based meat alternatives and cultivated meat companies, and development of ingredients and new products are examined.
The report has dozens of tables showcasing numerical survey data on consumer demographics and psychographics and numerous marketing photographs. This report goes in-depth on historical COVID-19 and inflation trends that have affected the food and beverage market.
For many years, concerns about health and the environment have led more consumers to plant-forward diets and plant-based meat alternatives to reduce meat intake. While some cease eating meats, dairy, or eggs, few consumers are willing to be so strict. Instead, a large group identify as flexitarian, meaning that they are reducing – but not eliminating – consumption of meat or other animal products in favor of plant-based foods.
Some of the top reasons that people are increasing intake of plant-based foods include:
-
health concerns – many people think that products made from plants are healthier
-
ethical/animal welfare concerns – ongoing publication of news stories about animal abuse and poor conditions at industrial farms is causing people to think more about where their food comes from and how it impacts the world
-
environmental concerns – worry about climate change is leading consumers to question whether meat can be part of a sustainable diet
-
seeking novelty – many consumers are curious about new products and are open to trying new foods
Many consumers are turning to plant-forward and plant-centric meals – including plant-based meat alternatives.
While some plant-based foods that are intended to imitate (or compete directly with) conventional meat or dairy products have historically been highly processed, an increasing number of products continue to be released with less processing and cleaner labels. This whole food image, where the plants take the lead rather than being hidden, particularly appeals to consumers who are changing their diets for health reasons.
Plant-based meat alternatives use plant proteins to attempt to replicate the flavors, functions, and/or textures of meat. These products’ naming and advertising conventions often incorporate terms such as:
-
plant-based meat
-
vegetarian/vegan meat
-
meatless meat
-
words that are clearly altered forms of the names of the meat products that they are imitating (e.g., chick’n, saus’ge)
Additionally, cell-cultured (or cultivated, lab-grown) meat products represent the next frontier of possibilities for meat alternatives. Two cultured chicken products were first approved for sale in the US in 2023.
Cell-cultured meat, poultry, and seafood products may go by many names in corporate and consumer culture, including “cultivated”, “cultured”, “lab-created”, “lab-grown”, “cell-based”, “slaughter-free”, “cruelty-free”, “clean”, “in vitro”, and “synthetic” meat.
Over the next decades, a large number of new meat products created from animal cells instead of slaughtered animals are expected to be released. A number of startups are developing these products, though there are many hurdles to overcome, particularly achieving economies of scale and being able to produce large-scale batches of product.
With a focus on “what’s next” and current consumer trends, Meat, Poultry, & Seafood Alternatives: Plant-Based and Cell-Cultured Types is packed with insights about consumer trends, behavior, and motivations to help food and beverage producers, retailers, packaging firms, employers, and investors gauge consumer perspectives and find areas for growth in a competitive market.
Meat, Poultry, & Seafood Alternatives: Plant-Based and Cell-Cultured Types delivers actionable predictions and recommendations designed to guide producers, retailers, and investors in making business decisions by providing data and insights about users of plant-based meat and consumer openness to cultivated meat products.
Report Methodology
The information contained in Meat, Poultry, & Seafood Alternatives: Plant-Based and Cell-Cultured Types was developed from primary and secondary research sources. Primary research includes interviews with food and beverage market experts; participation in and attendance at food industry events; and extensive internet canvassing.
Primary research also includes national online consumer polls of U.S. adult consumers (age 18+) conducted on an ongoing basis by Packaged Facts to analyze attitudes of consumers and their relevant food and beverage preferences.
Survey data from MRI-Simmons are used to analyze the demographics and psychographics of consumers.
Supplementing Packaged Facts’ exclusive surveys is analysis from the International Food Information Council Foundation’s (IFIC) 2024 Public Perceptions of Processed Foods Report and the 2024 Public Perceptions of Pesticide & Produce Consumption Report provide. These reports provide valuable insight into consumers’ perspectives on food purchasing decisions and diet and lifestyle choices. Additionally, IFIC’s 2023 Food and Health Survey is used to provide other useful information on consumer behavior.
Snacking Trends Are Important to Plant-Based Foods
Snacking trends can be pertinent to plant-based foods, including meat alternatives, because many people purchase packaged plant-based snack foods. Additionally, plant-based meat products and other plant-based snacks such as plant-forward crackers and popcorn are often consumed as snacks with a healthier perception than many other packaged snack foods (e.g., cookies or potato chips).
Changes to Snacking Habits in 2023
Packaged Facts’ May 2023 survey found that COVID-era habits of snacking more had dwindled. In fact, a greater number of consumers reported snacking less than they did pre-pandemic instead of more. For many consumers, snacking less may be a way to cut back on household expenses as inflation has increased prices for most household items. Consumers tend to consider packaged snack foods more expensive, discretionary purchases and tend to cut back on such products when economically stressed.
Despite Packaged Facts’ survey results showing decreased snacking activity, it is also worth noting that some people may snack more when they are cutting back on household expenses. For some, snacking throughout the day in place of meals may help them cut back on overall grocery expenditures.
Some people who consume plant-based products as a snack may decide to cut back to decrease spending. However, for many consumers, snacking is an essential part of their day; these individuals may be more likely to trade between items (e.g., eat fewer plant-based meat products and more conventional meat products, trade down to private label products in plant-based categories) than forego them altogether.
- Executive Summary
- Concerns about Health, Animal Welfare, and the Environment Are Causing People to Turn to Plant-Forwa
- Historical Plant-Based Meat Alternative Sales Trends
- The Future for Plant-Based Meat Products
- Expanding Product Assortment Creating New Opportunities for Growth
- Scope
- Recent Historical Trends
- Highlights
- Pandemic-Era Effects on the Meat Industry
- Consumers Have Become More Aware of How Meat Is Processed
- Meat Plant Closures During the Pandemic
- Increasing Meat Prices and Supply Shortages Can Make Plant-Based Meat More Attractive to Some Consum
- Rising Prices: From Supply Chain Crunches to Inflation
- Table | Consumer Concerns about Rising Food Prices, 2021 – 2024 (percent of consumers)
- Cutting Back on Household Expenses
- Table | Consumers Cutting Back on Household Expenses in the Last 12 Months, 2022 (percent of consumers)
- Table | Types of Household Expenses Cut Back on in the Last 12 Months, 2022 (percent of consumers)
- Table | Consumer Spending on “Extras”, 2023 – 2024 (percent of consumers)
- Private Labels Are More Desirable as Prices Rise
- The Vast Majority of Consumers Have Noticed the Rising Cost of Food, and Many Are Changing Their Pur
- Consumers Find Price More Important for Food Purchase Decisions in 2024
- Snacking and Healthy Eating Habits
- Snacking Trends Are Important to Plant-Based Foods
- Trends in 2022
- Changes to Snacking Habits in 2023
- Table | Current Snacking Activity Compared to Pre-Pandemic Levels, 2023 (percent of consumers)
- Dining Out
- Consumers Were Still Holding off on Dining Out in 2021 and 2022
- 2023 Trends Result from Inflation and Changed Habits
- Food Carryout, Delivery, Online Grocery Shopping, and Convenience Food Options
- The COVID-19 Pandemic Was the Jumpstart the Online Grocery Market Needed
- Impact on the Plant-Based Food Market
- Activity in 2022
- Activity in 2023 and 2024
- Table | Consumer Use of Food Ordering Methods in the Last 12 Months, 2024 (percent of consumers)
- Table | Consumer Frequency of Food Ordering Methods in the Last 3 Months, 2024 (percent of consumers who hav
- Table | Consumer Frequency of Food Ordering Habits Now Compared to 12 Months Ago, 2024 (percent of consumers
- Table | Consumer Expected Changes to the Frequency of Food Ordering Habits in the Next 12 Months, 2024 (perc
- Work Habits
- Food Trends in the Context of Changes to Work
- Changes to Work Patterns Continued in 2022
- Working from Home in 2023
- Table | Ability to Work from Home and Frequency of Remote Work, 2023 (percent of consumers)
- Table | Working at a Co-Working Space or Working from Home, 2023 (percent of consumers)
- Table | Consumer Rating of Experiences Working at a Co-Working Space or Working from Home, 2023 (percent of
- Table | Consumer Opinions on Working at a Co-Working Space or Working from Home, 2023 (percent of employed c
- Work Habits in 2024
- Table | Where Time Is Spent during a Typical Work Week, 2024 (percent of employed consumers)
- Typical Work Arrangements
- Changes to Travel Habits
- Table | Changes in Work and Leisure Travel Activity, 2024 (percent of consumers)
- Beyond the Pandemic Era: Future Concerns, Vaccines, and Sticky Habits
- Concerns about COVID-19 Variants
- Concerns about Future Potential Pandemic Outbreaks
- Table | Future Potential Pandemic Outbreak Concerns, 2023 (percent of consumers)
- Vaccination for the Flu and COVID-19
- Table | Consumer Vaccination Plans, 2023 (percent of consumers)
- Table | Consumer Vaccination Rates, 2024 (percent of consumers)
- Some Consumers Are Continuing to Wear Masks in Public and to Avoid Crowds
- Table | Consumer Habits Regarding Masks, Crowds, and Testing for COVID-19, 2024 (percent of consumers)
- Negative Personal Effects of the Pandemic
- Mental and Physical Health Effects in 2022
- Reporting Negative Mental States in 2023
- Continuing Mental and Physical Health Effects in 2024
- Table | Current Feelings on Mental and Physical Symptoms Compared to “Normal” or Preferred Level, 2024 (perc
- Stress Levels and Impact on Food/Beverage Consumption
- Overview and Market Trends
- Highlights
- Wins for Plant-Based Meat Suppliers Facing Definitional Challenges
- Animal Welfare & Environmental Issues Surrounding Meat and Poultry
- More Consumers Want Animals Raised for Food to Be Treated Humanely
- Table | Consumer Opinions about Humane Treatment of Animals Raised for Food, 2024 (percent of consumers)
- USDA Publishes New Rule on Organic Livestock Requirements
- “Humane” Claims May Signify No Meaningful Difference in Production Methods
- Meat and Poultry Agriculture and Environmental Issues Intertwined
- More Consumers Want Animals Raised for Food to Be Treated Humanely
- Seafood Also Presents Issues, Although They Differ from Meat and Poultry
- Trends in Meat and Seafood
- Most Households Purchase Meat, and Strong Majorities of Consumers Consume Meat
- Raising Animals More Naturally and Ethical Meat Consumption
- Per Capita Meat Consumption Expected to Decline Slightly in 2025
- Table | Per Capita Meat Disappearance, 2018-2023, 2024E, 2025P (pounds)
- Meat, Poultry, and Seafood Shipments
- Table | Meat, Poultry, and Seafood Shipments, 2018-2023, 2024E, 2028P (billion dollars and billion 2017 doll
- Seafood Seen as Healthier than Meat
- A “Reducetarian” Mindset is Growing Among Consumers Who Eat Meat (&It’s Not Just Among Flexitarians)
- Cultured Meat and Meat Alternatives Could Come to Overtake the Conventional Meat Market
- Clean Label Trends
- There Is No Single Universal Definition of “Clean Label”
- Popular Media Effects on Food Perceptions: Healthfulness, Safety, Environmental Sustainability, and
- Different Levels of Processing
- Some Plant-Based Meat Products Are Shedding the Image of Being Highly Processed
- Companies Are Investing in Blockchain and Big Data to Satisfy Consumer Desires for Transparency
- Consumers Think Small and Medium Businesses Have More Credibility
- Convenient Meals Can Be the Ultimate Selling Point for Busy Consumers
- Online Grocery
- Prepared Meals and Convenience Foods at Retail
- Meal Kits
- Meal Delivery Services
- Special Diets and Eating Trends
- Highlights
- Following Specific Eating Patterns/Diets
- Special Eating Restrictions and Preferences Followed
- Table | Special Eating Restrictions and Diets Followed, 2024 (percent of consumers)
- Younger Consumers and Those with Higher Incomes Are More Likely to Follow a Special Diet
- Priorities Placed on Food Characteristics
- Table | Priorities Placed on Foods, 2024 (percent of consumers)
- Table | Clean Label Priorities Placed on Foods, 2024 (percent of consumers)
- Motivations for Following Specific Eating Patterns
- Special Eating Restrictions and Preferences Followed
- Plant-Forward Diets (Vegan, Vegetarian, Pescatarian, and Flexitarian)
- Vegan
- Vegetarian
- Pescatarian
- Flexitarian
- Omnivore
- Plant-Based Eating and Sustainability Are Buzzwords Important to the General Public
- Penetration of Plant-Forward Eating Patterns
- Table | Prevalence of Plant-Forward Eating Habits/Diet Control, 2024 (percent of consumers)
- Table | Prevalence of Plant-Forward Eating Habits/Diet Control, 2019-2024 (percent of consumers)
- Who Is the Target Audience for Plant-Based Meat Alternatives?
- Reasoning for Plant-Based Eating Choices
- Table | Primary Eating Philosophy and Use of Plant-Based Meat Products by Factors that Affect Diet, 2024 (pe
- Table | Factors Strongly or Somewhat Affecting the Choice to Consume Plant-Based Meat Alternatives, 2024 (pe
- Table | Agreement on Statements about Plant-Based Meat, Poultry, and Seafood, 2024 (percent of consumers)
- Table | Reasons for Not Consuming Plant-Based Meat Alternatives, 2024 (percent of consumers who do not eat p
- Table | Reasons Consumers Are Not Open to Trying Cultivated, Cruelty-Free Meat Products, 2024 (percent of co
- Mindful and Intuitive Eating
- Definition
- Motivations for Practicing Mindful Eating
- Frequency of Feelings and Behaviors Associated with Mindful and Intuitive Eating Patterns
- Relationship with Food
- Food Allergies, Intolerances/Sensitivities, and Other Dietary Restrictions
- Food Allergies and Intolerances Among Consumers
- Commonly Avoided Ingredients and Allergens Are Often Used in Plant-Based Meat
- Consumers Following Plant-Forward Diets Are More Likely to Report Food Allergies or Intolerances
- Table | Food Allergies, Gluten Intolerance, and Lactose Intolerance by Primary Diet/Eating Philosophy and Us
- Snacking Trends
- Frequency of Snacking
- Table | Frequency of Snacking Habits on a Typical Weekday, 2024 (percent of consumers)
- Table | Frequency of Snacking More Than Once a Day or Eating Breakfast, 2024 (percent of consumers)
- Snacking Demographics
- Table | Always or Usually Eating Breakfast or Snacking More Than Once a Day by Demographic, 2024 (percent of
- Table | Always or Usually Eating Breakfast or Snacking More Than Once a Day by Plant-Based Demographic, 2024
- Reasons for Snacking
- Table | Reasons for Snacking, 2024 (percent of consumers)
- Preferred Types of Snacks
- Table | Preferred Types of Snacks, 2023 (percent of consumers)
- “Snackification” of Meals
- Product Examples
- Frequency of Snacking
- Nutrients Sought by Consumers
- Consumers Continue to Seek Out Protein Sources
- Sources Used to Consume Nutrients
- Health Benefits Sought
- Actions Taken to Avoid or Limit Saturated Fat
- Sugars, Sweeteners, and Artificial Ingredients
- Table | Consumer Agreement on Statements about Sugars and Avoidance of Ingredients, 2024 (percent of consume
- Market Size and Forecast
- Highlights
- Retail Sales of Plant-Based Meat, Poultry, and Seafood Products
- Scope
- Sales by Type
- Table | Plant-Based Meat Sales by Product Type, 2018-2024E (million dollars)
- Table | Plant-Based Meat Sales by Product Type, 2024E, 2025P-2029P, 2034P (million dollars)
- Beef
- Chicken
- Pork
- Veggie/Fruit Specified
- Non-Specified Meat
- Turkey
- Seafood
- Other Plant-Based Meat
- Sales by Form
- Table | Plant-Based Meat Sales by Form, 2018-2024E (million dollars)
- Table | Plant-Based Meat Sales by Form, 2024E, 2025P-2029P, 2034P (million dollars)
- Sales by Storage Method
- Table | Plant-Based Meat Sales by Storage Method, 2018-2024E (million dollars)
- Table | Plant-Based Meat Sales by Storage Method, 2024E, 2025P-2029P, 2034P (million dollars)
- Foodservice Demand for Plant-Based Meat, Poultry, and Seafood Products
- Scope
- Sales by Type
- Table | Foodservice Demand for Plant-Based Meat by Product Type, 2018-2024E (million dollars)
- Table | Foodservice Demand for Plant-Based Meat by Product Type, 2024E, 2025P-2029P, 2034P (million dollars)
- The Uncertain Landscape for Cell-Cultured (or Cultivated, Lab- Grown) Meat Products
- Scope
- The Beginning of Cultivated Meat Commercialization
- A Pause on Cell-Cultured Meat
- The Potential for Product Launches in the US – An Examination of Singapore
- Challenges and Opportunities for Cultivated Meat
- Market Leaders, Product Developments, and Innovations
- Highlights
- Plant-Based Meat, Poultry, &Seafood Brands
- National Brands
- Table | Select Plant-Based Meat Companies/Brands by Products Offered and Founding Date
- Private Labels
- Table | Select Plant-Based Meat Private Label Brands/Retailers by Products Offered
- National Brands
- Incubators and Venture Capital Funds Helping Startup Companies Develop New Proteins
- Table | Select Incubators & Venture Capital Funds Active in the Alternative Protein Space
- Funding for Plant-Based Meat, Poultry, &Seafood Companies
- Table | Investment in Select Plant-Based Meat & Ingredient Companies by Number of Funding Rounds and Latest
- Funding for Cultivated/Cell-Based Meat, Poultry, &Seafood Companies
- Table | Investment in Select Cultivated Meat Companies by Number of Funding Rounds and Latest Funding Round
- Comparison of Nutrition Information of Plant-Based Burgers
- Table | Comparison of Nutrition Information of Select Plant-Based Burgers, 2020
- Ingredient Development
- Ingredient Suppliers May Make Plant-Based Ingredients Used by Food Producers in Plant-Based Meat Pro
- Making Plant-Based Meat with a Cleaner Label
- New Raw Materials and Processes Such as Fermentation Can Be Used to Develop Products That Better Mim
- Plant-Based Meat, Poultry, &Seafood Market Leaders of Note
- Before the Butcher
- Beyond Meat
- Gardein (Conagra Brands)
- Good Catch Foods (Ahimsa Companies)
- Impossible Foods
- Lightlife Foods & Field Roast (Maple Leaf Foods)
- MorningStar Farms, Incogmeato (Kellanova, formerly Kellogg)
- Pure Farmland (Smithfield Foods)
- Sweet Earth (Nestlé USA)
- Tofurky (Morinaga Nutritional Foods)
- Yves Veggie Cuisine (Hain Celestial)
- Consumer Demographics: Who Eats Plant-Based Meat, Poultry, or Seafood Alternatives, and Who Is Open
- Highlights
- Use of Plant-Based Meat Products
- Historical Trends on Use of Vegetarian Frozen or Refrigerated Burgers
- Table | Household Use of Vegetarian Frozen or Refrigerated Burgers, 2019-2024 (percent of consumers)
- Vegetarian Frozen or Refrigerated Burger Brands Used
- Table | Use of Vegetarian Frozen Burger Brands, 2024 (percent of consumers)
- Frequency of Vegetarian Frozen or Refrigerated Burger Use
- Table | Packages of Vegetarian Frozen or Refrigerated Burgers Used in the Last 30 Days, 2024 (percent of con
- Use of Plant-Based Meat Alternatives
- Table | Consumer Use of Plant-Based Meat, Poultry, and Seafood Alternatives by Type, 2024 (percent of consum
- Table | Consumer Use of Plant-Based Meat, Poultry, and Seafood Alternatives by Form and Storage Method, 2024
- Where Consumers Buy Plant-Based Meat Alternatives
- Table | Types of Stores Where Consumers Buy Plant-Based Meat Alternatives, 2024 (percent of plant-based meat
- Overlap with Use of Plant-Based Meat and Plant-Based Dairy Products
- Table | Overlap with Use of Plant-Based Burgers and Plant-Based Milk in the Last 6 Months, 2024 (percent of
- Table | Overlap with Use of Plant-Based Meat and Plant-Based Dairy, 2024 (percent of consumers)
- Historical Trends on Use of Vegetarian Frozen or Refrigerated Burgers
- Openness to Trying Cultivated/Cruelty-Free Products
- Table | Openness to Trying Cultivated, Cruelty-Free Meat Products, 2022 and 2024 (percent of consumers)
- Trends by Plant-Forward Diets Followed
- Table | Use of Vegetarian Frozen or Refrigerated Burgers by Plant-Forward Diets Followed, 2024 (percent of c
- Table | Use of Plant-Based Meat Products by Plant-Forward Diets Followed, 2024 (percent of consumers)
- Table | Openness to Trying Cultivated/Cruelty-Free Products by Plant-Forward Diets Followed, 2024 (percent o
- Table | Openness to Trying Cultivated/Cruelty-Free Products by Types of Plant-Based Meat Eaten, 2024 (percen
- Trends by Gender
- Table | Use of Vegetarian Frozen or Refrigerated Burgers and Following of Plant-Forward Diets by Gender, 202
- Table | Use of Plant-Based Meat Products by Gender, 2024 (percent of consumers)
- Table | Openness to Trying Cultivated/Cruelty-Free Products by Gender, 2024 (percent of consumers)
- Trends by Age Bracket
- Table | Use of Vegetarian Frozen or Refrigerated Burgers and Following of Plant-Forward Diets by Age Bracket
- Table | Use of Plant-Based Meat Products by Age Bracket, 2024 (percent of consumers)
- Table | Openness to Trying Cultivated/Cruelty-Free Products by Age Bracket, 2024 (percent of consumers)
- LGBT Consumers
- Table | Use of Vegetarian Frozen or Refrigerated Burgers and Following of Plant-Forward Diets by LGBT Affili
- Patterns Based on Household Income
- Table | Use of Vegetarian Frozen or Refrigerated Burgers and Following of Plant-Forward Diets by Household I
- Table | Use of Plant-Based Meat Products by Household Income Bracket, 2024 (percent of consumers)
- Table | Openness to Trying Cultivated/Cruelty-Free Products by Household Income Bracket, 2024 (percent of co
- Regional Differences
- Table | Use of Vegetarian Frozen or Refrigerated Burgers and Following of Plant-Forward Diets by US Region,
- Table | Use of Plant-Based Meat Products by US Region, 2024 (percent of consumers)
- Table | Openness to Trying Cultivated/Cruelty-Free Products by US Region, 2024 (percent of consumers)
- Urban, Suburban, and Rural Consumers
- Table | Use of Vegetarian Frozen or Refrigerated Burgers and Following of Plant-Forward Diets by County Size
- Table | Use of Plant-Based Meat Products by Urban/Suburban/Rural Living, 2024 (percent of consumers)
- Table | Openness to Trying Cultivated/Cruelty-Free Products by Urban/Suburban/Rural Living, 2024 (percent of
- Educational Attainment
- Table | Use of Vegetarian Frozen or Refrigerated Burgers and Following of Plant-Forward Diets by Educational
- Table | Use of Plant-Based Meat Products by Educational Attainment, 2024 (percent of consumers)
- Table | Openness to Trying Cultivated/Cruelty-Free Products by Educational Attainment, 2024 (percent of cons
- Presence of Children in the Household
- Table | Use of Vegetarian Frozen or Refrigerated Burgers and Following of Plant-Forward Diets by Parenthood,
- Table | Use of Plant-Based Meat Products by Presence of Children in the HH, 2024 (percent of consumers)
- Table | Openness to Trying Cultivated/Cruelty-Free Products by Presence of Children in the HH, 2024 (percent
- Race/Ethnicity
- Table | Use of Vegetarian Frozen or Refrigerated Burgers and Following of Plant-Forward Diets by Race/Ethnic
- Table | Use of Plant-Based Meat Products by Race/Ethnicity, 2024 (percent of consumers)
- Table | Openness to Trying Cultivated/Cruelty-Free Products by Race/Ethnicity, 2024 (percent of consumers)
- Online Grocery Shoppers (Food Delivery and Pickup Services)
- Table | Use of Vegetarian Frozen or Refrigerated Burgers and Following of Plant-Forward Diets by Use of Onli
- Table | Use of Plant-Based Meat Products by Use of Online Grocery Websites in the Last 30 Days, 2024 (percen
- Table | Openness to Trying Cultivated/Cruelty-Free Products by Use of Online Grocery Websites in the Last 30
- Consumer Psychographics and Motivations for Eating Choices
- Highlights
- Consumers Who Eat Plant-Based Meat Products or Follow Plant- Forward Diets Are More Likely to Shop a
- Table | Grocery Purchases from Selected Retailers in the Last 30 Days by Type of Plant-Forward Diets Followe
- Grocery Shopping and Eating Habits
- Table | Consumer Agreement on Statements about Grocery Shopping and Eating Habits, 2024 (percent of consumer
- Table | Consumer Agreement on Statements about Grocery Shopping and Eating Habits, 2024 (percent of consumer
- Cooking Skills
- Table | Consumer Confidence with Cooking Skills, 2024 (percent of consumers)
- Organic Food Purchases
- Table | Consumer Agreement on Statements about Organic Food Purchases, 2024 (percent of consumers)
- Table | Consumer Agreement on Statements about Organic Food Purchases, 2024 (percent of consumers who agree)
- Food Processing and Clean Ingredients and Labels
- Table | Consumer Agreement on Statements about Clean Ingredients, Food Processing, and Labels, 2024 (percent
- Table | Consumer Agreement on Statements about Clean Ingredients, Food Processing, and Labels, 2024 (percent
- Willingness to Pay More for Premium Food Characteristics
- Table | Consumer Agreement on Statements about Willingness to Pay More for Premium Foods, 2024 (percent of c
- Table | Consumer Agreement on Statements about Willingness to Pay More for Premium Foods, 2024 (percent of c
- Humane Treatment of Animals and Local Sourcing
- Table | Consumer Agreement on Statements about Animal Products and Humane Treatment of Animals, 2024 (percen
- Table | Consumer Agreement on Statements about Animal Products and Humane Treatment of Animals, 2024 (percen
- Sustainability Trends
- What Consumers Think about Sustainability Issues and Sustainable Lifestyles
- Table | Consumer Agreement on Statements about Sustainability, 2024 (percent of consumers)
- Table | Consumer Agreement on Statements about Sustainability, 2024 (percent of consumers who agree)
- Table | Importance of Practices When Living a Sustainable Lifestyle, 2024 (percent of consumers)
- Table | Importance of Practices When Living a Sustainable Lifestyle, 2024 (percent of consumers who think ea
- Recycling and Composting Services
- Table | Consumer Access to Recycling and Composting Services, 2024 (percent of consumers)
- Table | Consumer Usage Frequency of Recycling and Composting Services, 2024 (percent of consumers who report
- Thoughts on Packaging and Waste
- Table | Consumer Agreement on Statements about Recycling and Packaging Materials, 2024 (percent of consumers
- Table | Consumer Agreement on Statements about Recycling and Packaging Materials, 2024 (percent of consumers
- Table | Packaging Types Considered Most Eco-Friendly, 2024 (percent of consumers)
- Table | Importance of Sustainable and Eco-Friendly Packaging Characteristics, 2024 (percent of consumers)
- Consumers Think that Environmental Responsibility Is Personal
- Table | Environmental Attitudes among Organic/Natural Food Consumers, 2024 (percent of consumers who complet
- What Consumers Think about Sustainability Issues and Sustainable Lifestyles
- Consumer Attitudes on Food and Health
- Cooking Attitudes
- Table | Cooking Attitudes by Plant-Forward Diets Followed, 2024 (percent of consumers who agree completely)
- Attitudes on Convenience Foods, Being Busy, and Stress
- Table | Attitudes on Convenience Foods, Being Busy, and Stress by Plant-Forward Diets Followed, 2024 (percen
- Nutrition and Health Attitudes
- Table | Nutrition and Health Attitudes by Plant-Forward Diets Followed, 2024 (percent of consumers who agree
- Attitudes on Premium Foods and Paying for Food
- Table | Attitudes on Premium Foods and Paying for Food by Plant-Forward Diets Followed, 2024 (percent of con
- Openness to New Food Experiences
- Table | Attitudes on Openness to New Food Experiences by Plant-Forward Diets Followed, 2024 (percent of cons
- Attitudes on Exercise and Alternative Medicine
- Table | Attitudes on Exercise, Mental Health, and Alternative Medicine by Plant-Forward Diets Followed, 2024
- Cooking Attitudes
- Consumer Perceptions of Processed Foods and Healthy Foods
- Preferences for Product Labels Show “Natural”, “Organic”, and “Healthy” Increase Consumer Confidence
- Many Consumers Limit Purchases of Processed Foods, But Most People Still Eat Them
- Table | Consumer Opinions about Processed Foods, 2024 (percent of consumers)
- A Large Segment of the Population Avoids Added Sugars and Artificial Ingredients
- Table | Consumer Opinions about Added Sugar, Refined Sugar, and Artificial Ingredients 2024 (percent of cons
- Why People Eat Packaged Foods
- Most People Say Eating a Healthy Diet Is Important to Them
- Consumers Are More Likely to Consider Organic Foods and Foods without Artificial Ingredients or Addi
- People Use Similar Label Indicators to Determine Healthfulness of Foods When Dining Out
- The Majority of Consumers Consider How Food Is Grown
- Eating Fruits and Vegetables and Practicing Balance Are Most Important to Eating Healthier
- Fitting Processed Foods into a Healthy Diet
- Confusion on What “Processed Food” Means
- Types of Foods Considered to Be Processed
Shipments of meat, poultry, and seafood valued at the manufacturers’ level grew at an average rate of 5.3% from 2018 to 2023.
Cell-cultured meat, poultry, and seafood products may go by many names in corporate and consumer culture, including “cultivated”, “cultured”, “lab-created”, “lab-grown”, “cell-based”, “slaughter-free”, “cruelty-free”, “clean”, “in vitro”, and “synthetic” meat.
Packaged Facts reports that the 2024 market size for plant-based meat alternatives is $1.4 billion in the US.