Report Overview
What roofing material segment is projected to grow the fastest?
-
Solar roofing will grow due to building codes and government incentives
This Freedonia industry study analyzes the $24 billion US market for roofing. It presents historical demand data (2012, 2017, and 2022) and  forecasts (2027 and 2032) as well as annual data for years 2019-2026. Unit demand and value demand data is shown for roofing by material (asphalt shingle, metal, bituminous, plastic, rubber, tile, wood), product type (Standard laminated shingles, high-performance shingle, three-tab shingle, standing seam, metal shingle, metal shake, metal tile, corrugated panel, modified bitumen, built-up roofing, thermoplastic polyolefin, polyvinyl chloride, ethylene-propylene, neoprene, butyl, concrete tile, clay tile, porcelain tile, wood shingle, wood shake, spray polyurethane foam, composite shingle, synthetic roofing, slate, liquid-applied roofing, tensioned fabric, vegetative roofing, solar roofing) and market (new and reroofing demand in both residential and commercial buildings). The study also evaluates company market share and competitive analysis on industry competitors including GAF, Owens Corning, CertainTeed, and Johns Manville.
Featuring 227 tables and 69 figures – available in Excel and Powerpoint! Learn More
See our blog highlighting Metal Roofing!
US roofing demand is forecast to increase slightly from an elevated 2022 base to 277.5 million squares in 2027. Growth in real terms will be restrained, largely due to a decline in conventional housing starts – following a surge in 2020 and 2021 – that began in 2022 and is expected to continue through 2024, with sluggish growth thereafter. A slowdown in residential reroofing activity after a surge in 2020 and 2021 will also depress growth.
Market value will see a significant deceleration from the 2017-2022 period, as most roofing product prices will moderate following price spikes that occurred due to supply chain issues and high raw material costs. However, market value is still expected to outpace real growth because of the increasing use of higher value roofing products with enhanced performance and aesthetic properties.
Strong Growth for Solar Roofing Supported by Building Codes & Government Incentives
While most small volume roofing products will see gains throughout the forecast period, solar roofing demand is expected to grow at an exceedingly fast rate due to current and future “green” building codes and state-driven incentives, particularly in California:
-
California’s CALGreen building code requires most newly built and substantially renovated structures to meet zero net energy criteria by 2030; installing solar roofing can help meet this criteria.
-
Currently, 25 states offer some sort of sales tax exemption for solar energy devices and 36 states offer property tax exemptions. More states are expected to offer incentives as the use of solar panels becomes more widespread.
A reduction in solar roofing prices over time – due to decreasing manufacturing costs, economies of scale, government investment, and financial incentives – will also encourage greater adoption of this product.
Metal Roofing Will Continue to Gain Market Share
Metal roofing has steadily gained share in the US roofing market over the past decade thanks to both its good performance and aesthetics. This product’s share of the market will continue to rise due to several factors, including:
Historical Market Trends
Shifts in demand for roofing can vary from year to year and are determined by numerous factors, primarily those related to building construction activity. They include:
-
levels of housing starts, particularly in the single-family housing segment
-
the size and age of the US housing stock
-
interest rates – low interest rates may encourage home and business owners to take out lines of credit often used to fund roof repair and replacement projects
-
the number and types of commercial buildings erected or repaired in any given year
-
the type of roof (e.g., steep-slope or low-slope) installed on a structure that will be repaired or replaced
-
the types of roofing materials most often specified by contractors and other consumers in a particular region of the US
-
the roofing materials originally installed on the structure
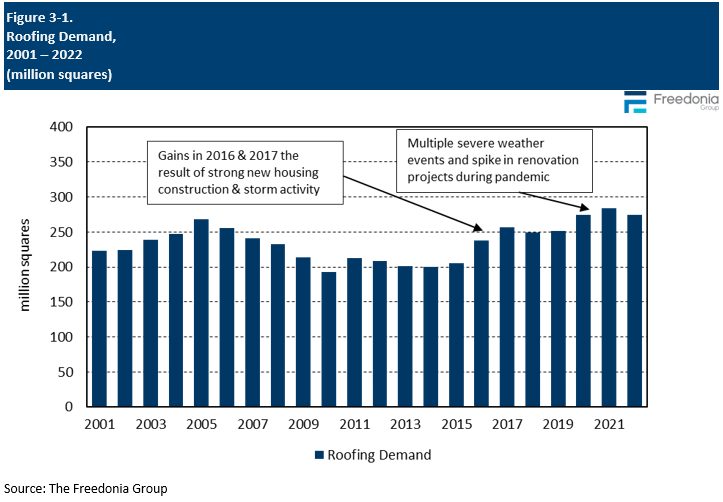
The US has a significant number of homes and businesses with roofs that are at or near the end of their life expectancies. Thus, age-related reroofing is the most significant driver of roofing demand in the US.
Additionally, multiple other variables can affect demand for roofing in a particular year or over a short period of time. Among these are:
-
weather conditions, especially outbreaks of severe weather that can cause widespread damage to roofs (e.g., hurricanes and tropical storms, tornadoes, hailstorms, and winter storms)
-
changes and modifications to state and local building codes
-
the adoption of legislation (such as the Tax Cuts and Jobs Act of 2017) that can cause a temporary increase in reroofing activity
-
insurers requiring homeowners to replace older or worn roofs with newer materials that better resist severe weather on condition of maintaining coverage
-
changes in the price of raw materials (e.g., asphalt, metal, lumber) that can cause the per-square cost of roofing materials to increase or decrease sharply
Roofing demand advanced rapidly in 2020, a marked contrast to the weaker demand levels of 2018 and 2019. This growth was spurred by multiple outbreaks of severe weather across the US and an increase in residential roofing demand precipitated by the COVID-19 pandemic. Levels increased again in 2021 despite continued restraint from supply chain issues and increased inflation. Roofing demand in volume terms declined in 2022 due to a loss in housing starts and weakness in commercial building construction, but market value continued to exhibit growth because of continuing inflation and supply chain disruptions.
Value Demand by Product
Roofing demand in value terms is expected to rise at an average annual pace of 1.0% to $24.2 billion in 2027. This significant deceleration in growth from the previous forecast period stems largely from a moderation in most average roofing product prices due to supply chain normalization and reduced residential market demand. Demand will be supported by a shift toward more expensive products that will offset the forecast stagnation in area demand.
In addition, the market continues to move toward higher-value roofing products that are perceived as better-performing and/or aesthetically superior, which will further boost market value. Despite the higher costs, consumers value the longer lifespans (reducing long-term replacement costs) and enhanced curb appeal.
Higher-value roofing products include:
-
laminated asphalt shingles
-
standing seam metal roofing
-
polymer-modified bituminous membranes
-
plastic single-ply and rubber roofing membranes with thicker scrims
-
roofing til
New vs Reroofing Trends
Roofing products are used in two main applications based on when they are installed:
-
new construction, which comprises newly erected buildings on which roofs are installed for the first time
-
reroofing, which encompasses buildings on which roofs or parts of roofs are being repaired or replaced
Factors that influence the type of roofing used during new and reroofing projects include:
-
the type of roofing material previously installed on the building or used on nearby buildings
-
customer interest in one type of roofing over another
-
the cost of a project (for both materials and installation)
Both new and reroofing demand will be restrained over the forecast period:
-
Reroofing activity will be limited by the high level of roof repair and replacement in 2020 and 2021 – structures that were worked on in that timeframe are unlikely to require additional repairs in the near future – along with the rising use of more durable materials, that will need replaced less often.
-
Demand for roofing in new construction will be hindered by the increased construction of roofing-intensive structures during the pandemic – such as manufacturing plants, warehouses, and healthcare facilities – which will cool over the next few years.
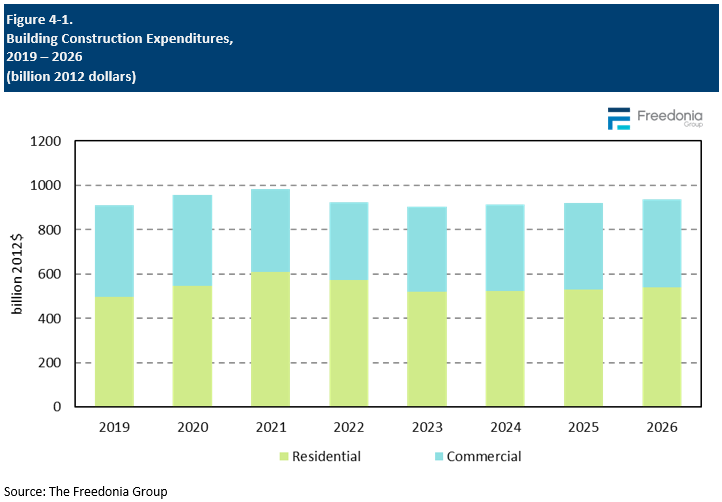
Building Construction Activity
A key factor affecting demand for roofing is the health and composition of the US construction industry. Roofing is installed on virtually every structure erected to keep out the elements and can play an important role in improving a building’s energy efficiency. While the choice of roofing materials can vary due to a number of factors, structures are seldom installed without a roof. While not all roofs are installed with underlayment, building codes in nearly all US code jurisdictions mandate the use of underlayment in structures with steep-slope roofs. As a result, construction of residences, lodging, office, and institutional buildings is most important to underlayment sales.
Real building construction expenditures are expected to increase by an average of nearly 1% per year through 2027: